Knowing how much your crops are yielding is obviously important to your farming business. But just looking at the total amount harvested might not be telling you the full story! If you need to know more details like an average per acre/hectare or average per plant, you can access the Crop Type Harvest page to see those additional details. You'll also find helpful information like average per bed, per field, and per square foot/square meter. These averages are also available on multiple reports, and can be added to custom reports as well.
Let's start by navigating to your My Crops page. Pick the crop type that you have harvested previously, and then access the Harvests tab. You'll immediately see a header with important harvest information. In our example below, we are working with some peppers that were planted in two grow locations that used three total beds and five total rows. This was a total of 374 plants, and 663 square feet. Be aware that we have more peppers planted than this, but the calculations only use data from plantings that have a harvest record associated with them. Plantings that have not yet been harvested are not counted towards the totals.

The data you'll see on the page is cumulative for this crop types and includes harvests from any season. Don't worry, you can run reports to supply a date range to see seasonal data; we'll go over that later in this article. Here's what you'll see, and how it's calculated. We also reference our example in the image above in the italicized text so you can see the real world examples of the formulas.
- Total Harvested - This combines all of the harvested amounts for this crop type as a total.
- Average Per Square Foot/Meter - The total harvested divided by the total square area planted and harvested for this crop type. That was 663 sqft. for our peppers, so we divide 632 by 663 for 0.95 pounds per square foot.
- Average Per Location - Is the total harvested, divided by the number of different grow locations the crop is planted and harvested in. Regardless of the number of times it was planted in a location, the total harvested is divided by the number of locations the crop was harvested in, giving you a overall "life of the field" result. We have two locations planted and harvested for these peppers, Northwest Field B and Pepper Plot 2, so we divide 632 by 2 for 316.
- Average Per Bed - The total harvested divided by the total number of beds that are planted and harvested across all grow locations. Note that if the same crop is planted in the same bed, it will count as two, as this metric could be looked at as "average per bed planting". We had 3 beds planted, so we divide 632 by 3 for 210.67 per bed. "per bed planting"
- Average Per Row - The total harvested divided by the total number of rows in the beds referenced above. We have 5 total rows in our 3 beds, with 2 beds having 2 rows, and 1 bed only using 1. That's 632 divided by 5, for 126.4 per row.
- Average Per Plant - The total harvested divided by the total number of plants across all plantings that have been harvested. We had 374 plants spread across those plantings, so each plant is yielding about 1.67 pounds.
Yield Reporting
Beyond the averages you see on the crop type page, you'll also find a few useful reports to see you harvest data and these averages. Just access the reports section and choose Plantings, and you'll these reports. There are also other Harvest reports covered in this separate article.
Yield Stats by Crop Type - This report combines all of the statistics we outlined above for all of your crop types in a single report. You'll also have a date range here to see the data within a given season, year, quarter, etc.
Yield Stats by Planting Location - Similar to the one above, but organized by Grow Location within a given crop type. This may help you see what grow location is most productive for your crop type. In our example below, it looks like Northwest Field B was much more productive than the pepper plot, perhaps we need to add some amendments or mimic the treatments we applied to Northwest Field B there!

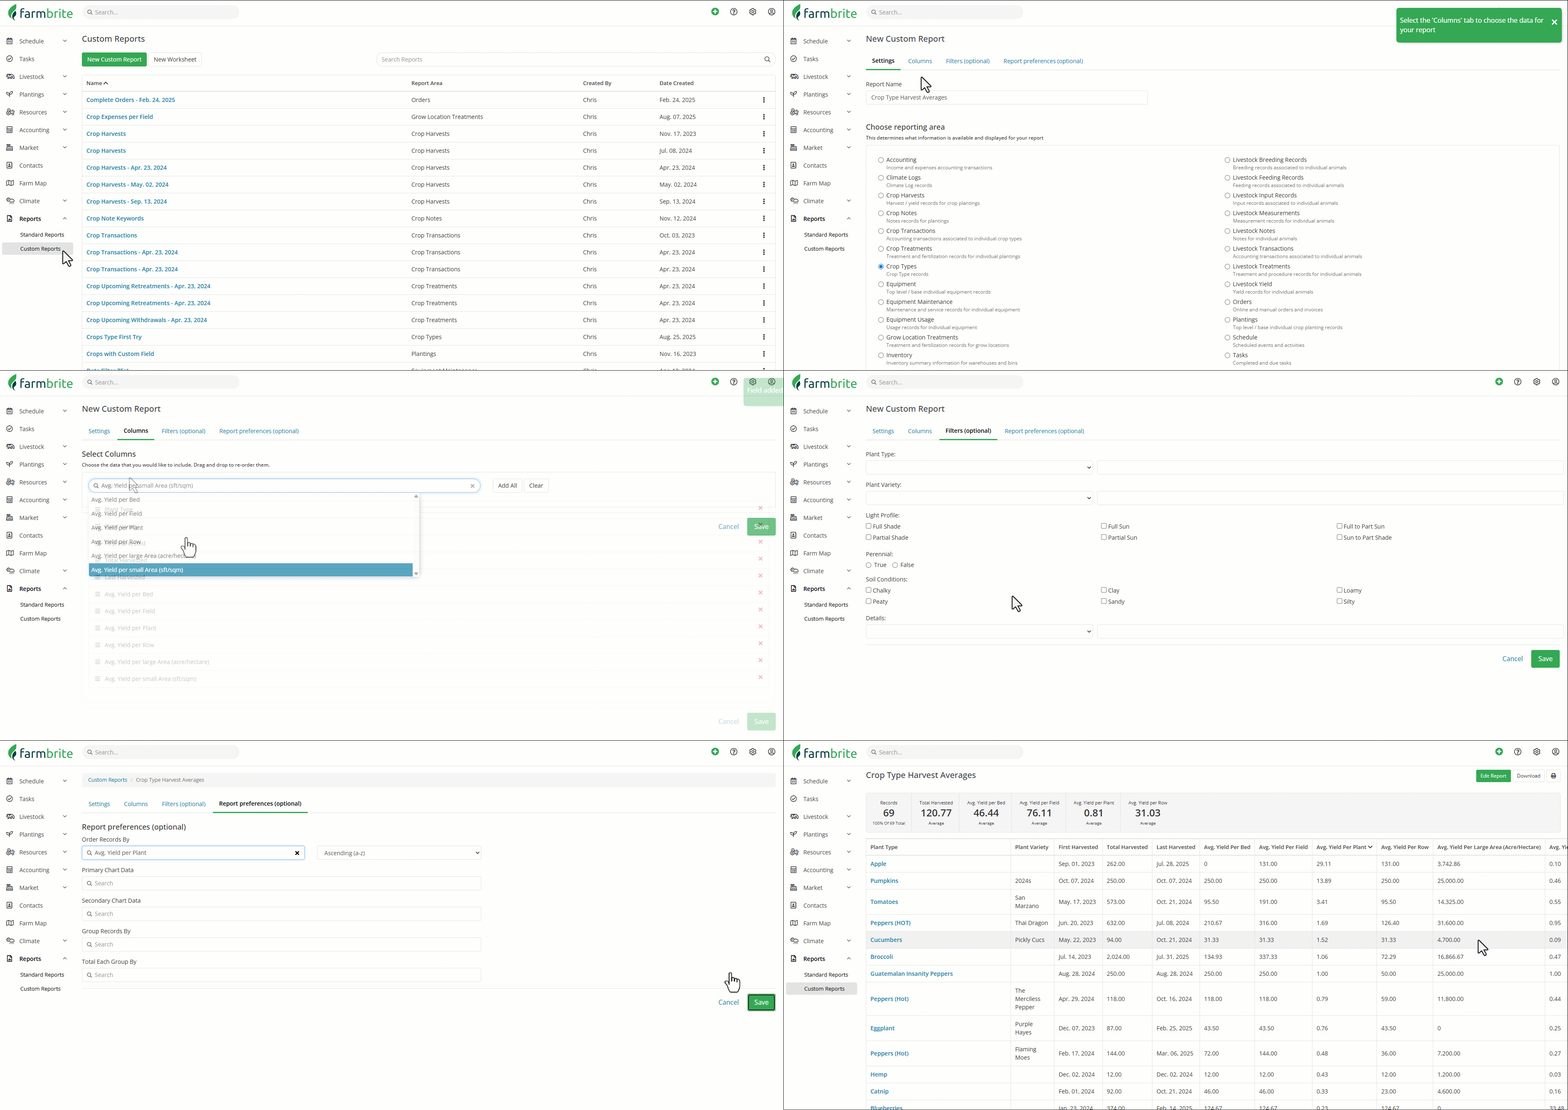
You can also add these averages to custom reports. They are available in both the Crop Type and Plantings custom reports. You can find more information about building custom reports in this separate article, but check out the image below for an example as well.

Let us know if you have any additional questions or feedback about using this feature!