When you measure your livestock, you'll usually think of physical measurements like height and weight. But beyond that, you may want to consider other factors to determine the overall health and wellness of your animal. Assessing specific areas like their eyes, nose, mouth, and ears can help you pinpoint areas that need attention and flag problems before they get out of hand. Additionally, tracking factors like environmental cleanliness, temperature, and air quality can help you address potential problems before they even start by ensuring optimal living conditions for your livestock. When you record measurements in Farmbrite, you can track these additional details to get a more holistic view of your overall animal wellness.
To learn more about recording measurements overall, check out this separate article and video.
If you create a measurement that includes any ratings on the Health or Environment tab, Farmbrite will use the data you supply to calculate a Wellness Score. You'll see this on the measurement record itself, and on the main animal details page. That means you will see it at a glance when you access the animal's record and can track the progress from the measurements page. It is charted there so you can easily see the changes over time.

They are also color coded so you'll immediately know if the score represents a healthy animal, or one with potential issues. The lowest possible score is a 20, and scores between there and 40 are shown in red. 41-60 shows in yellow, 61-80 in blue, and above 80 is green.
Calculating the Wellness Score
The Wellness score is meant to be a simple way for you to see a rating and immediately know the animal's overall condition. It combines and calculates the results of the Health and Environment sections from the measurement to arrive at a single overall wellness score. We outline the formulas and calculations below if you want to dive into the math, but know that overall the single Wellness score should give you a good idea of the health of the animal on a scale of 20-100.
There are 20 gradable areas in the health section and 6 for the environment. Therefore, we add additional weight to the health score, as it has a greater impact on the overall wellness, and includes immediately observable issues with the animal itself. It is important to know that the scale or Poor through Excellent is represented as 1-5 numerically, with Poor = 1, Fair = 2, Okay = 3, Good = 4, and Excellent = 5. Beyond that, it's also important to realize the score is calculated based on how many of the 26 total fields you complete. Not all are required, so the score is variable based on what data you provide in the measurement.
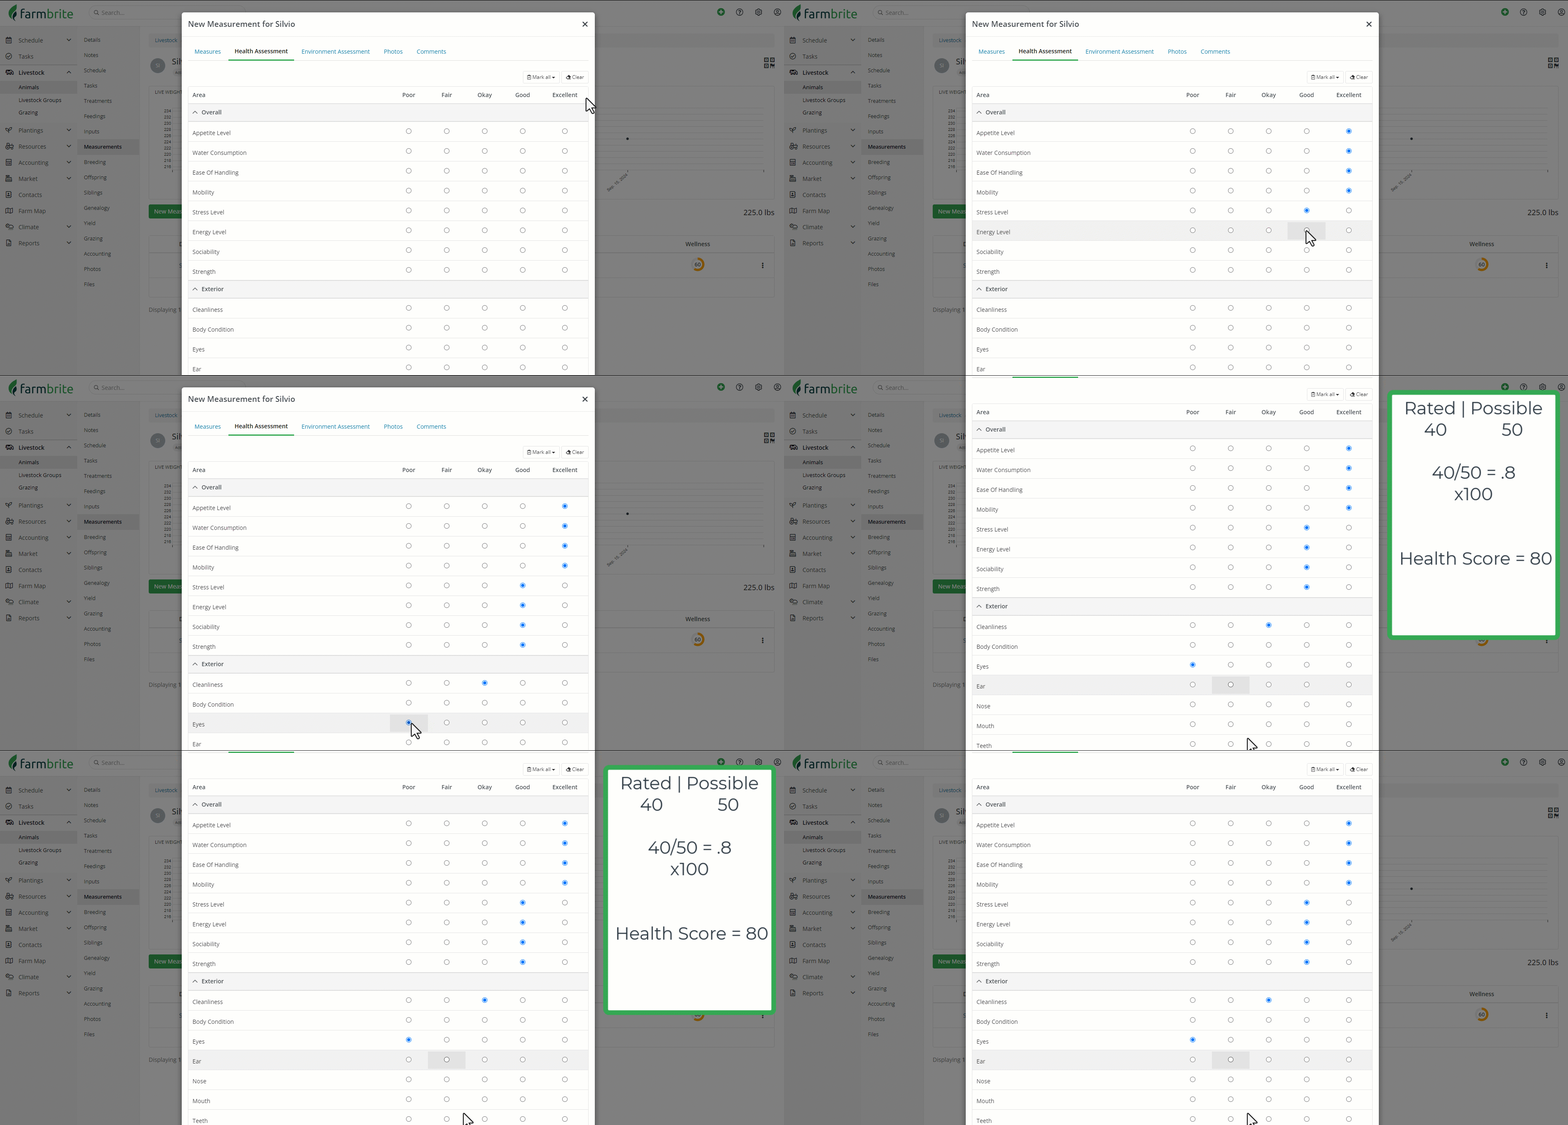
To calculate the Health score, sum the number of points the animal scored and divide it by the number of possible points. This can be represented as [points earned/possible points]. Each individual rating/metric has a total possible points of 5. Here is an example:
- You completed 10 fields, with varied results. 4 Excellent (20 points), 4 Good (16 points), 1 Okay ( 3 points), and 1 Poor (1 point). That is a total of 40 out of 50, which is thus a score of 80.

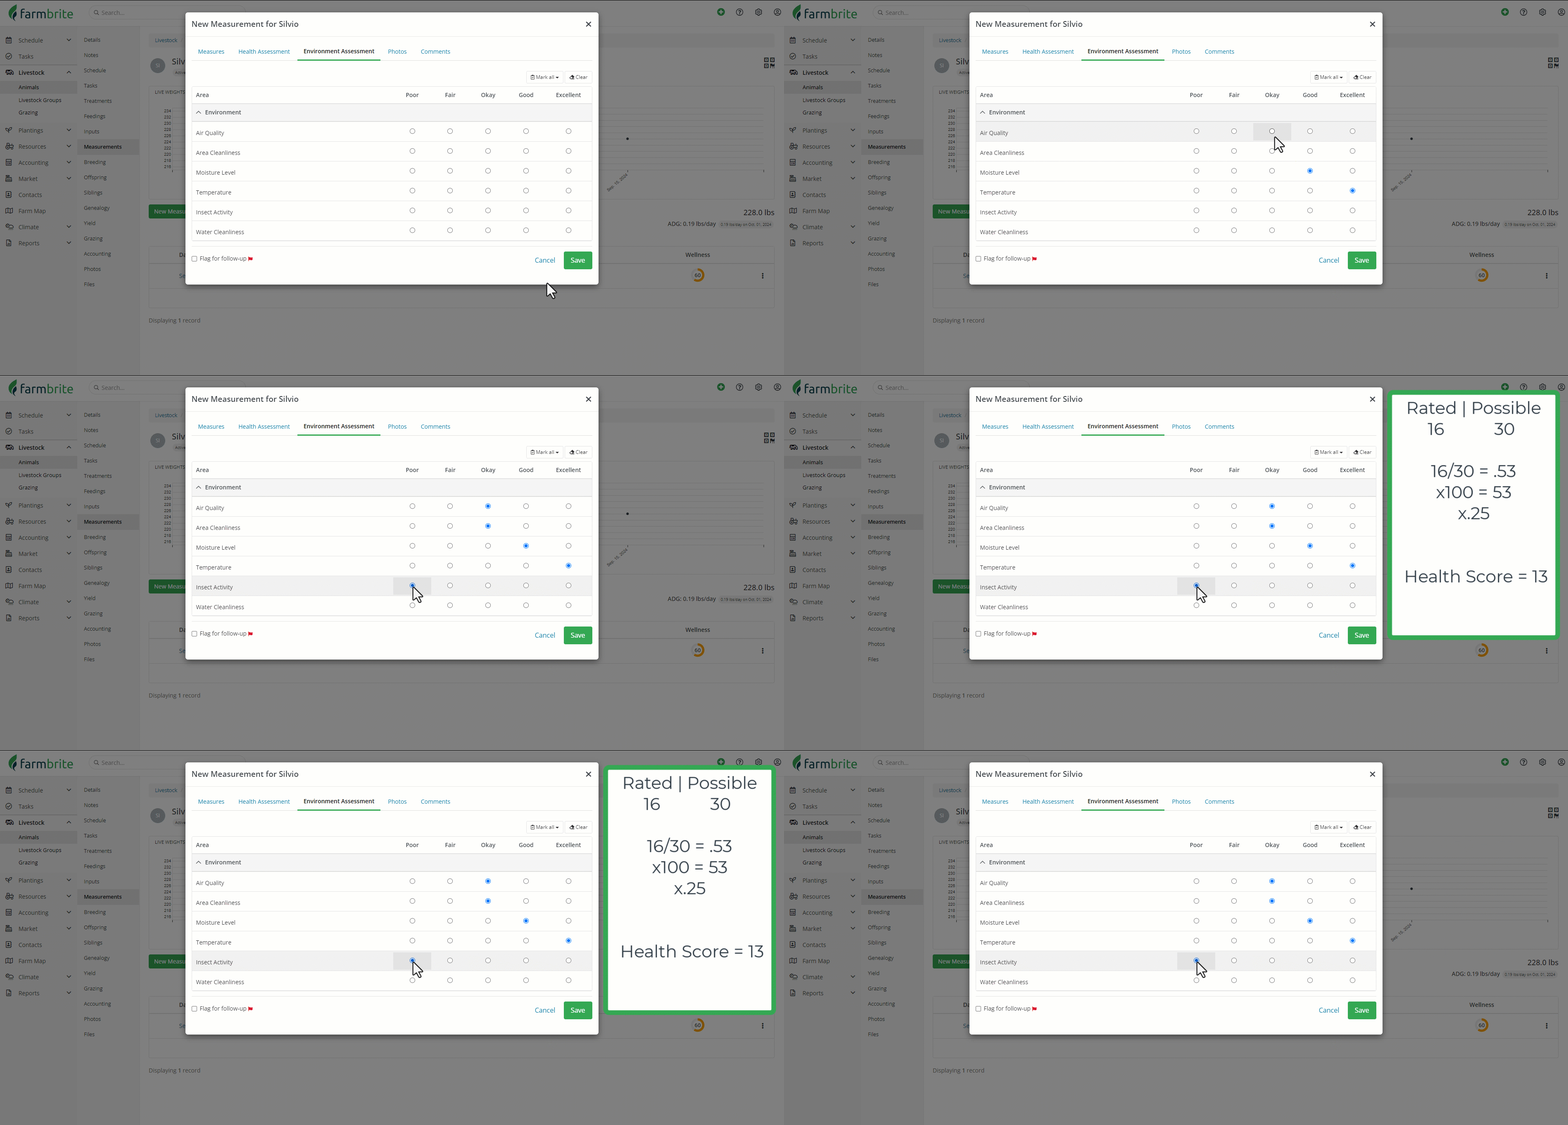
The Environment score is calculated similarly, except it is weighted less out of 100. You'll still divide the total points by the possible points, but since there are only six fields the maximum score possible is 30. To account for the score being less impactful to the overall animal wellness than the 20 health fields, you'll then multiply the Environment score by .25 to weigh it correctly. Here is an example
- You completed 5 fields, with varied results. 1 Excellent (5 points), 1 Good (4 points), 2 Okay ( 6 points), and 1 Poor (1 point). That is a total of 16 out of 30, which is thus a score of 53. With the .25 weight, the score is thus 13.

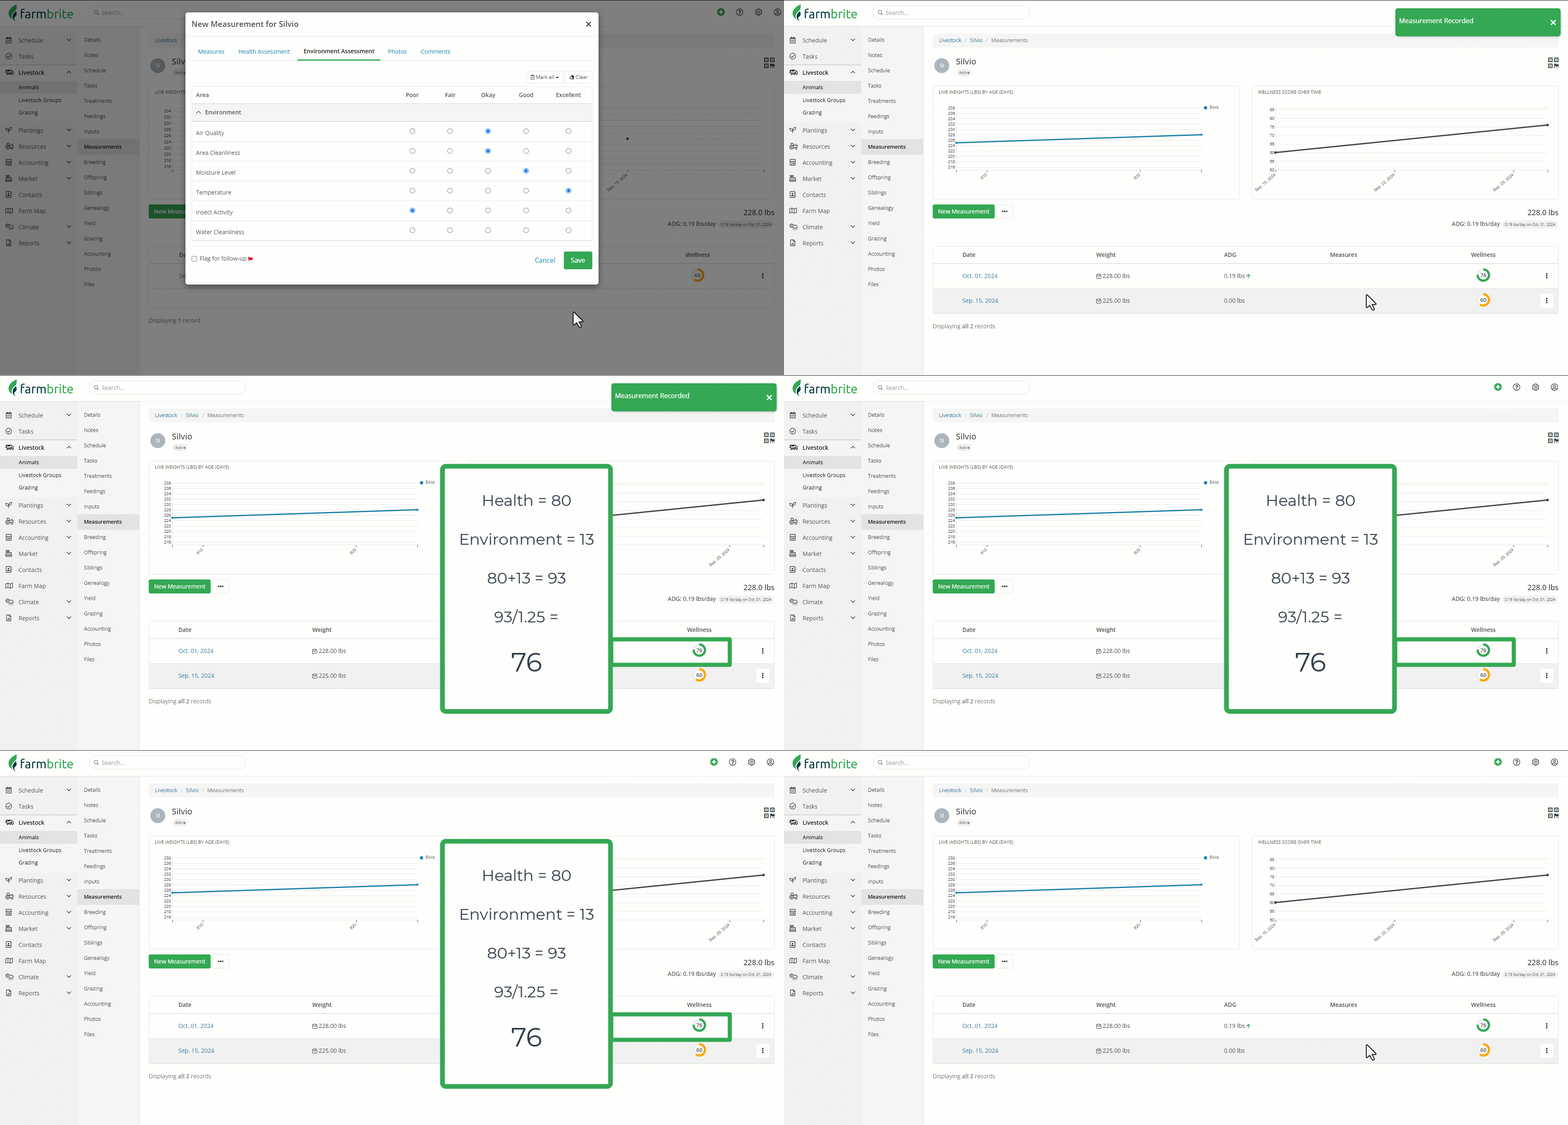
The overall Wellness Score is calculated by combining the two and dividing the sum by 1.25. The example below corresponds to the Health and Environment scores from each section above.
- A Health score of 80 plus an Environment score of 13 totals 93, which divided by 1.25 gives us an overall score of 74.

Wellness Report
There are 4 different reports that you can run to see animal wellness data.
Health and Wellness Watchlist - This report shows you any recent measurements that resulted in a Wellness score below 60. That's an easy way to find problematic animals, even if you didn't flag them for a follow-up. And speaking on that..
Wellness Follow-ups - This report shows you any measurements that were flagged for a follow-up. When you add the measurement you can check the box to flag it, and then run this report to see any that need to be addressed. This gives you a simple way to make sure you complete the required follow-up measurements. This report also displays the individual Health Assessment Score and Environment Assessment Score as well.
Measurements - This standard measurements report shows all your animals, categorized by animal type, with their most recent measurements.
Customer Reports - You can also include the Health, Environment, and Wellness Assessment scores on a custom report. This lets you build the exact report you are looking for with specific data fields, filters, grouping, and sorting. For more information on creating custom reports, check out this article from our Help Center.
Wellness in Livestock Groups
You can also see Wellness data on the Measurements tab of a livestock group. This is somewhat different for Set groups and Smart/Basic groups, so let's explore them both below.
Set Groups are used to track multiple animals as a single unit, like a flock of poultry or a school of fish. Thus, when you add the measurement records to the group you are inputting averages for all of the data points. Average weight of course, and also average health and environment scores. So you will take general observations about your group, and record them in the measurement. You can always use the Photos and Comments tab to include additional details like "Tag 742 showing signs of disease, see attached photo" or "Rooster is healthy but some hens are not eating..." etc.
Smart and Basic Groups are groups of individual animal records, and you'll still add the measurement records on each individual animal. However, the group Measurement tab will display data that combines and averages all of the group members. You'll see a chart here for Wellness scores over time, with each point on the graph being an average of the group member scores that day.

Bonus Tips: You can edit the columns on your group Dashboard to include the Last Wellness Score there, and you can filter your groups by Wellness score too! That lets you make dynamic smart groups that always contain your animals with specific score ranges.

Have questions on how you can use the score? Reach out, we're happy to help!


