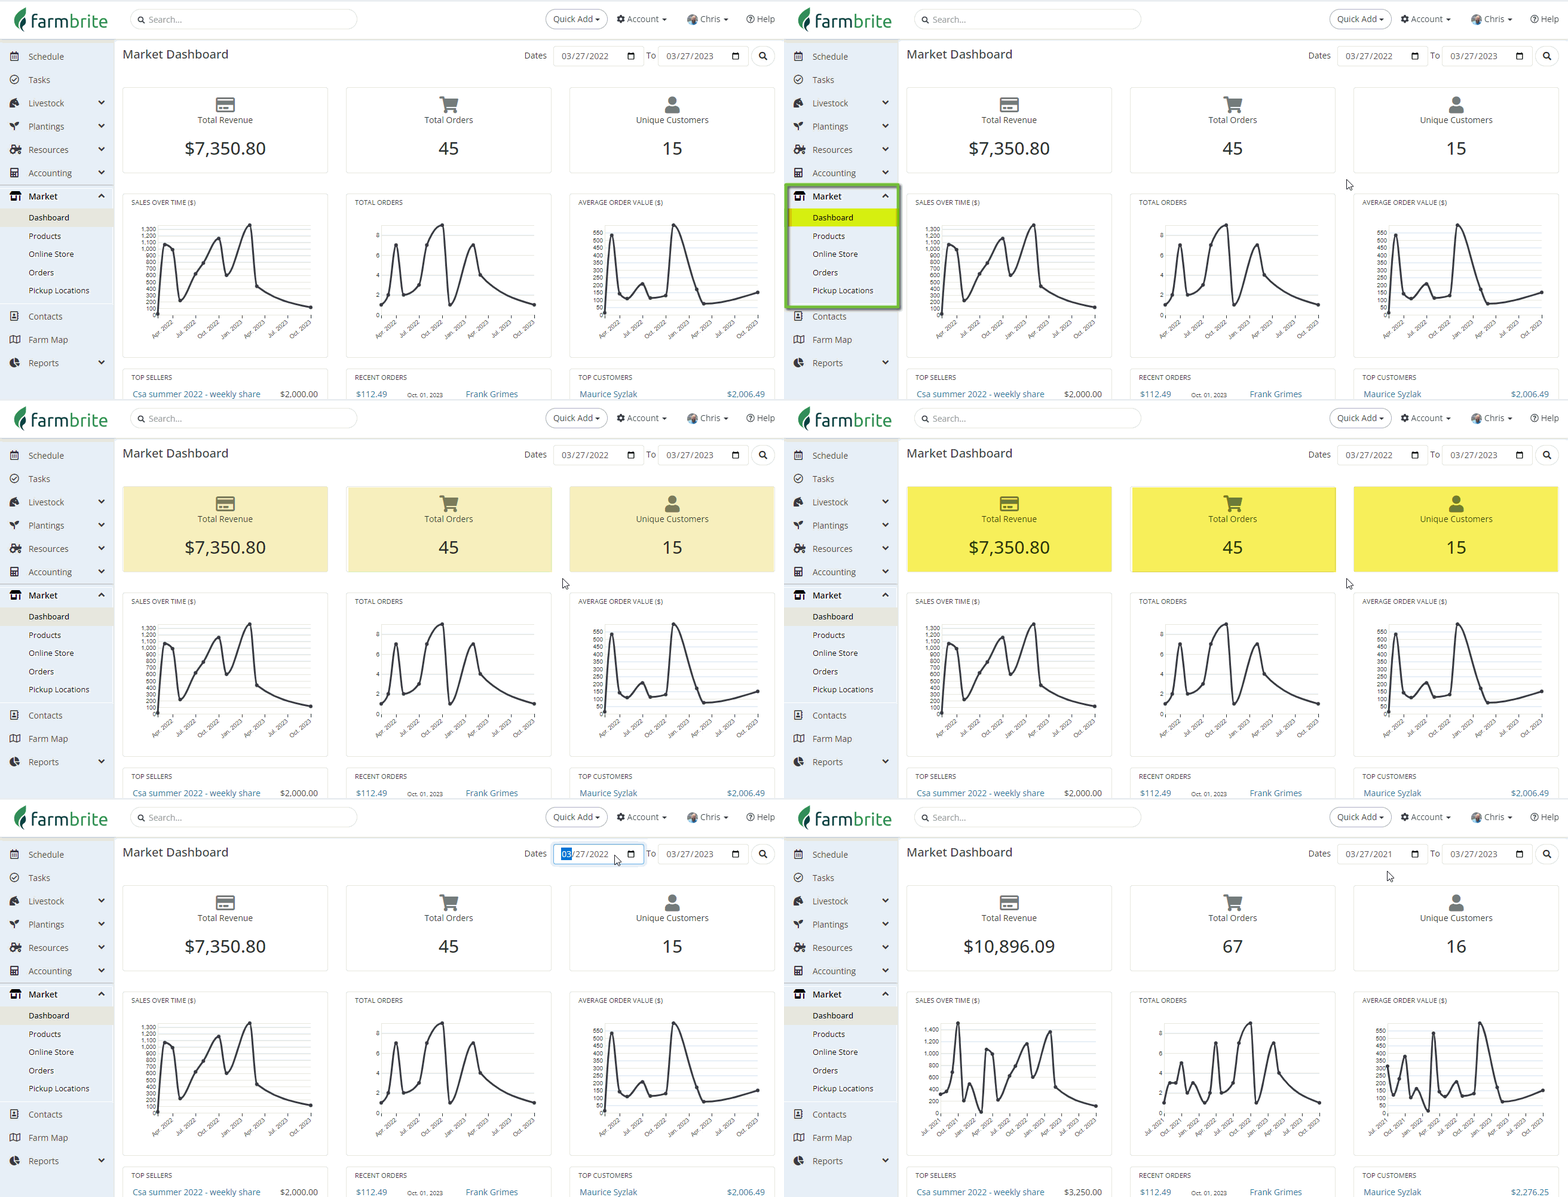
When you first access the Market section you'll land on your Market Dashboard. This is meant to be a quick summary of critical information for your Farmbrite store. It will show you graphs and lists for your revenue, orders, products, and customers. All of this is available at-a-glance to give you the most import information in one spot.
Don't worry if this is blank for you right now; once you follow the tutorials in this section of the Farmbrite Help Center you'll be on your way to figuring out your best selling products, building relationships with your best customers, and tracking order trends in no time.
The Market Dashboard is organized into three separate sections. The data presented is determined by the date range selected in the upper right; it defaults to the past year from today's date. You can update this to see trends and totals over a longer or shorter period of time.
You'll find key totals in the top row. This includes your Total Revenue, Total Orders, and total Unique Customers. This is basically a summary of the most important information about your orders; how much were they for, how many were there, and how many people purchased from your store. Note that the Total Revenue displayed is calculated based on order totals, which include any discounts added to orders. So if you offer discounts, the total displayed may not match your total item sales from the Top Sellers chart below.

The next section shows you three graphs. All graphs show data for each month within your selected date range.
- Sales Over Time - This tracks your total revenue each month.
- Total Orders - This displays the total number of orders each month.
- Average Order Value - This shows the average order revenue total for each month.
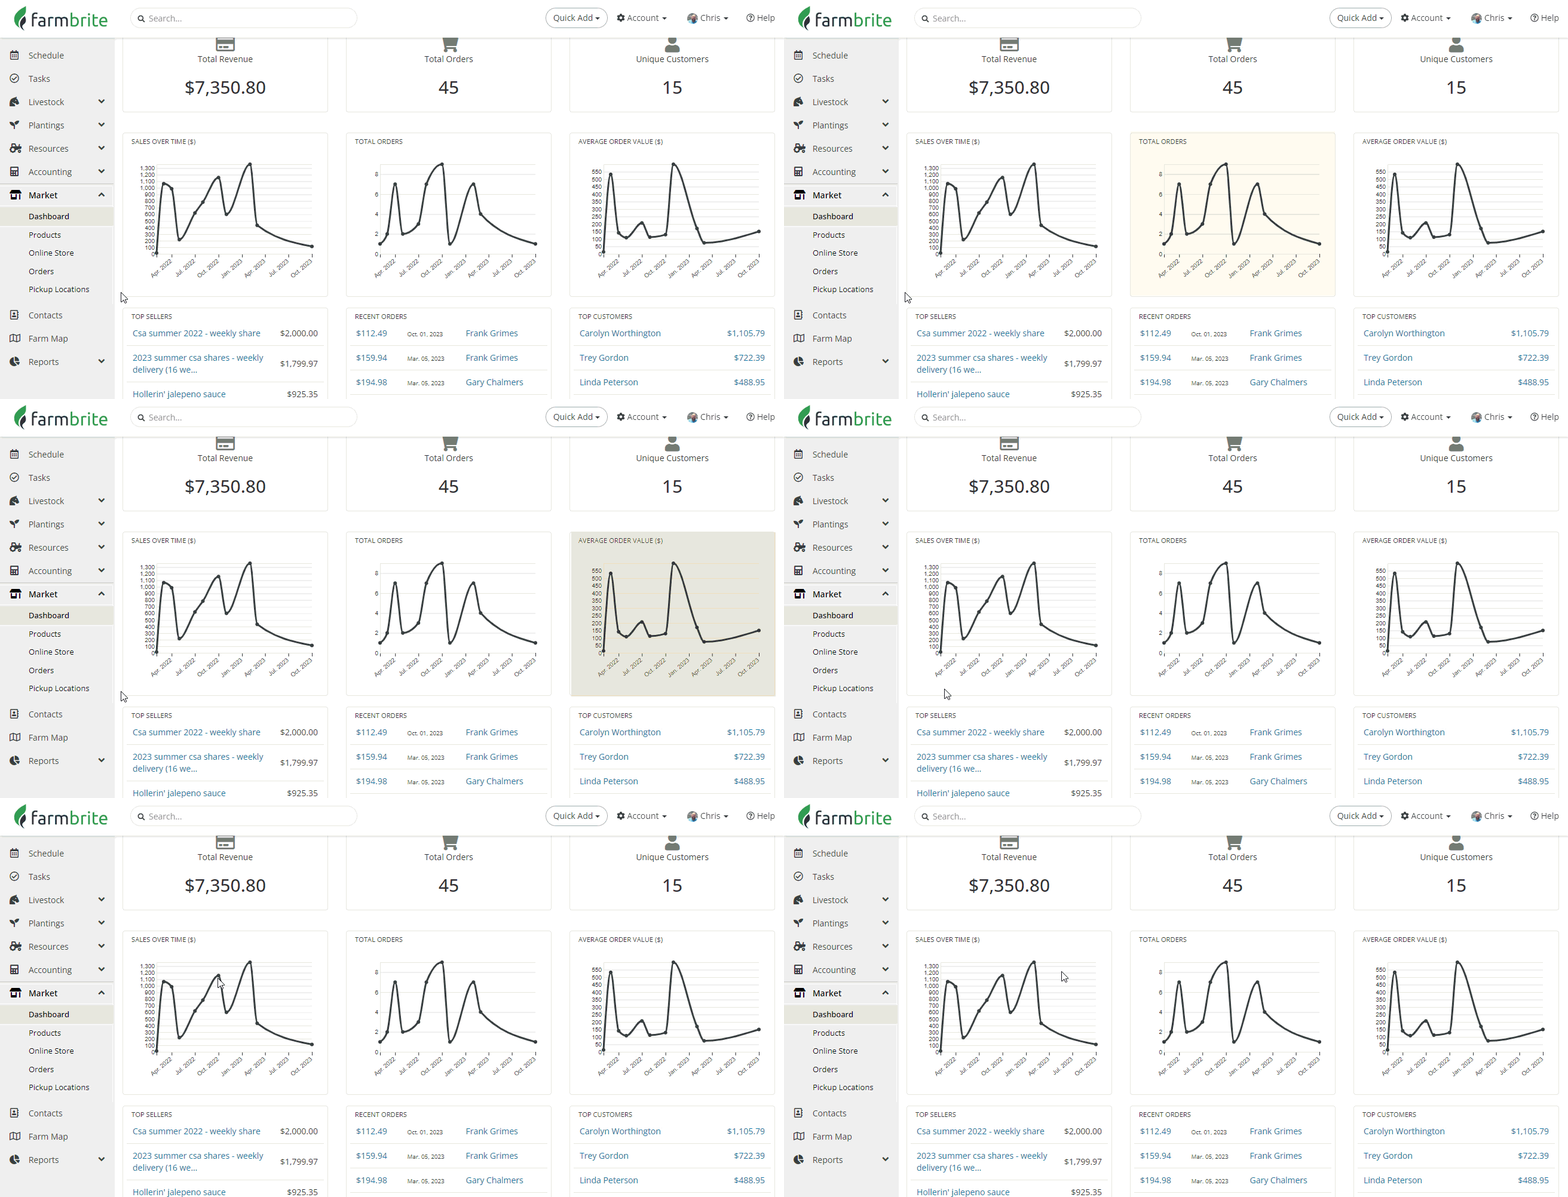
While you might not see each month listed at the bottom of the graph, you can hover your mouse pointer over any plotted dot on the chart to see totals for that particular month.

The last section shows three lists. Like your graphs, the data presented is dependent on your date range selected.
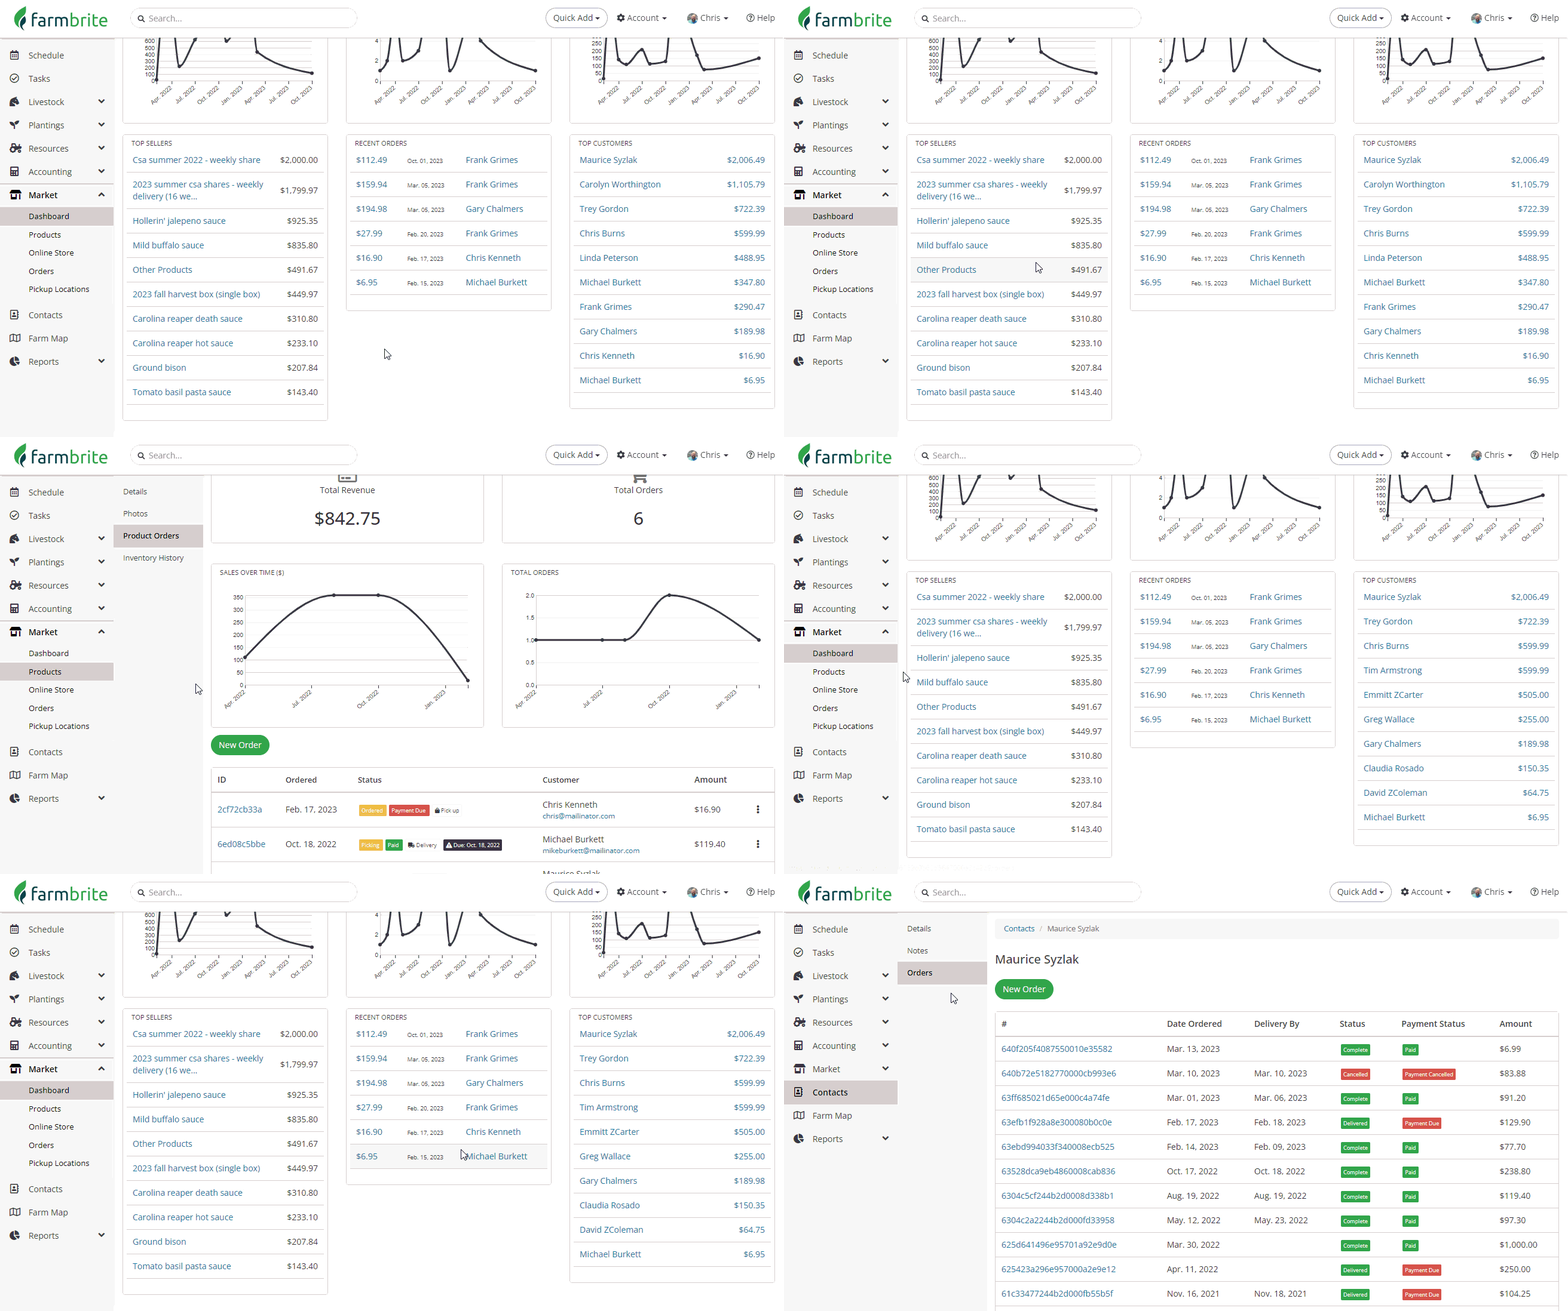
- Top Sellers - This shows your best selling products ordered by total sales revenue.
- Recent Orders - Your most recently created orders are listed here.
- Top Customers - This displays your top customers based on total revenue/total amount spent in your store.
Links are available in each list to go directly to the product, order, or customer. You might find the product link especially helpful as it will bring you to a list of orders for that product, with additional charts and graphs similar to the Market Dashboard. Clicking on a specific top customer will bring you to a list of their orders.

Data Mining: How can you use this information?
We know there is a lot of information presented here, and we want you to make the most of it. Give some thought to how you can use this information to help streamline your business operations and prepare for seasonal variances.
- Examine the Sales charts to find seasonal trends to help you prepare for busy times.
- See what items were popular last year at certain times and be sure you produce enough to meet demand.
- Determine what items were not popular and adjust your plantings accordingly.
- Adjust your prices to clear out those slow selling items as well.
- Predict cash flow and revenue for upcoming seasons based on historical trends.
- Find top customers and reach out to them proactively to assess their future needs before creating your crop plan.
- Send those top customers discounts or VIP deals to express your gratitude.