No matter what type of business you are managing with Farmbrite, you'll probably want to know what you're spending on expenses and how much income you're bringing back in. That means you'll want to record transactions on each side of that ledger, and have them automatically totaled to calculate that profit or loss. You might be spending money on livestock feed, plant nutrients, equipment maintenance, and many other things. Likewise, you might generate income by selling livestock, distributing produce in a CSA share, or even through government grants and loans. Farmbrite can take those ledger transactions and generate reports that specifically correlate with the IRS Schedule F Tax Form 1040 categories by default, or you can customize your own chart of accounts for the categories that work for your business. You'll also find charts and graphs on your Accounting Dashboard to help you track your accounting throughout the year at a glance.
This article is a high level overview of the Farmbrite Accounting system. To learn more details about each feature, click the links within each section below to be brought to additional help articles.
Accounting Dashboard
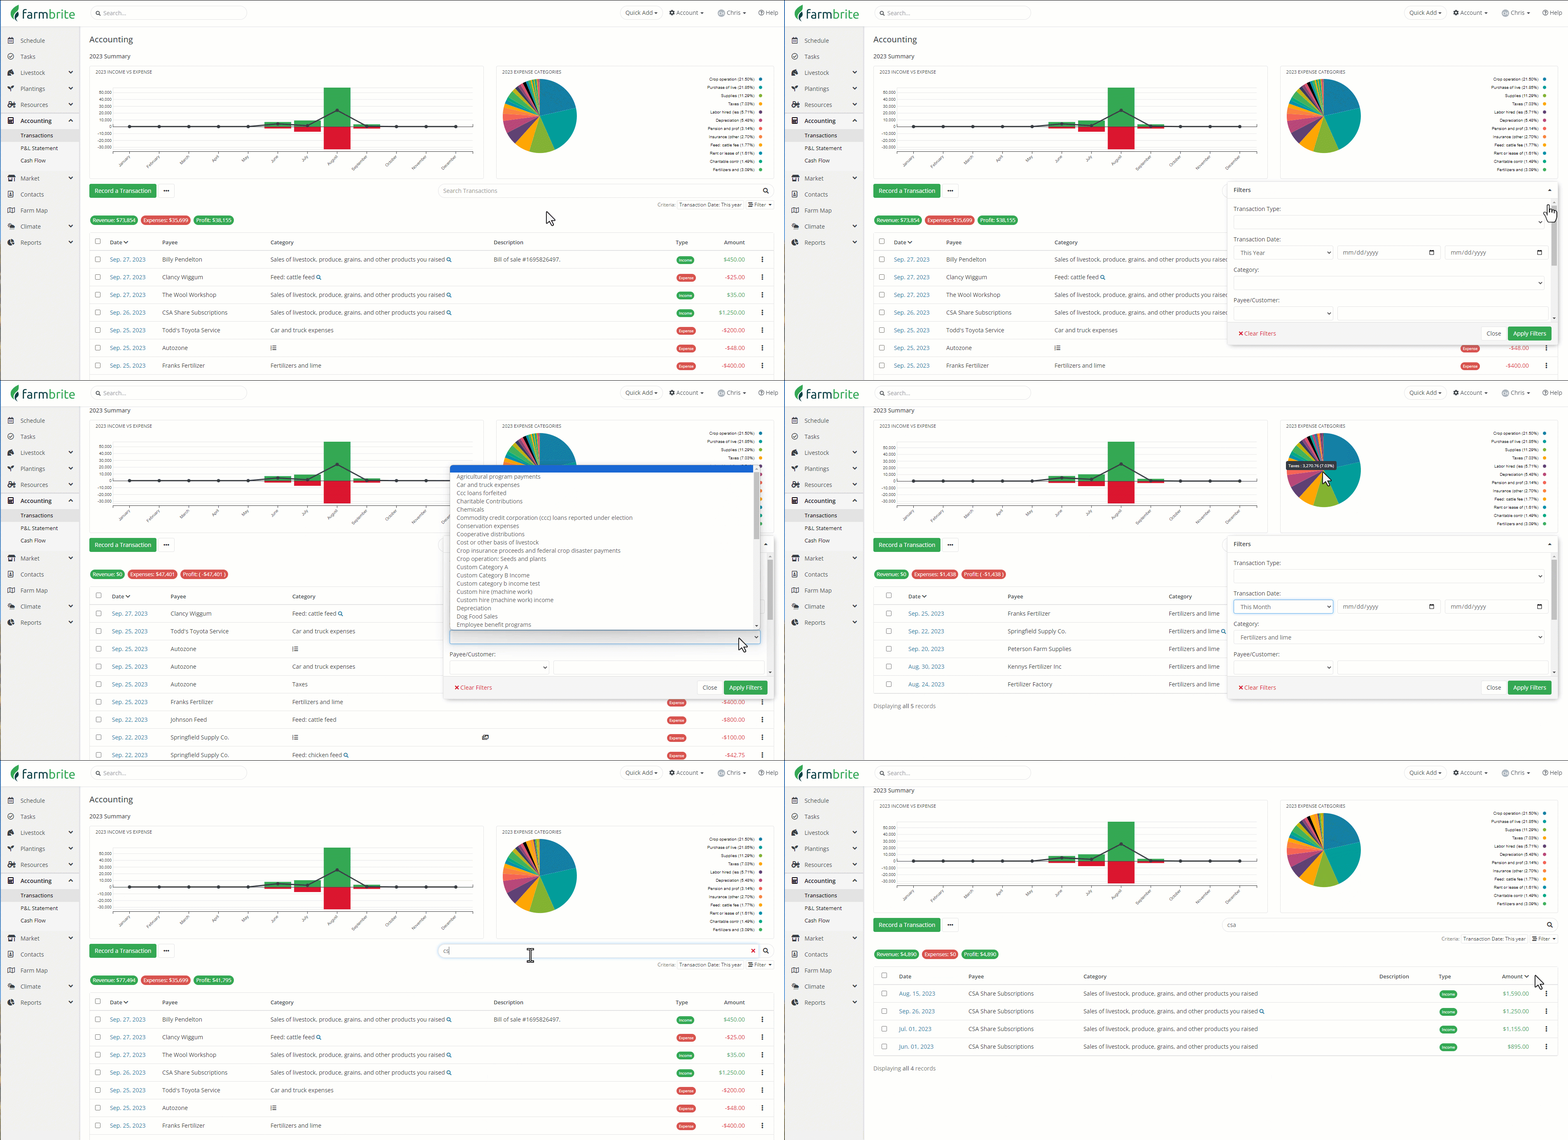
When you select Accounting from the main menu, you'll arrive on your Accounting Dashboard. This is the central hub of your Farmbrite Accounting system. You can create transactions here, and view all of the transactions you've previously created. You'll immediately see charts at the top; the left shows a monthly summary of income compared to expenses, and the right categorizes those expenses into a pie chart by type. These easy to read charts provide at-a-glance information to help you see profitability and what your money is being invested in. All of your transactions for this reporting year are shown below the charts for you to easily search and filter too. This helps you find exactly what you are looking for by keyword, date range, category, or reporting year, and then sort the results how you'd like.
Accounting Categories
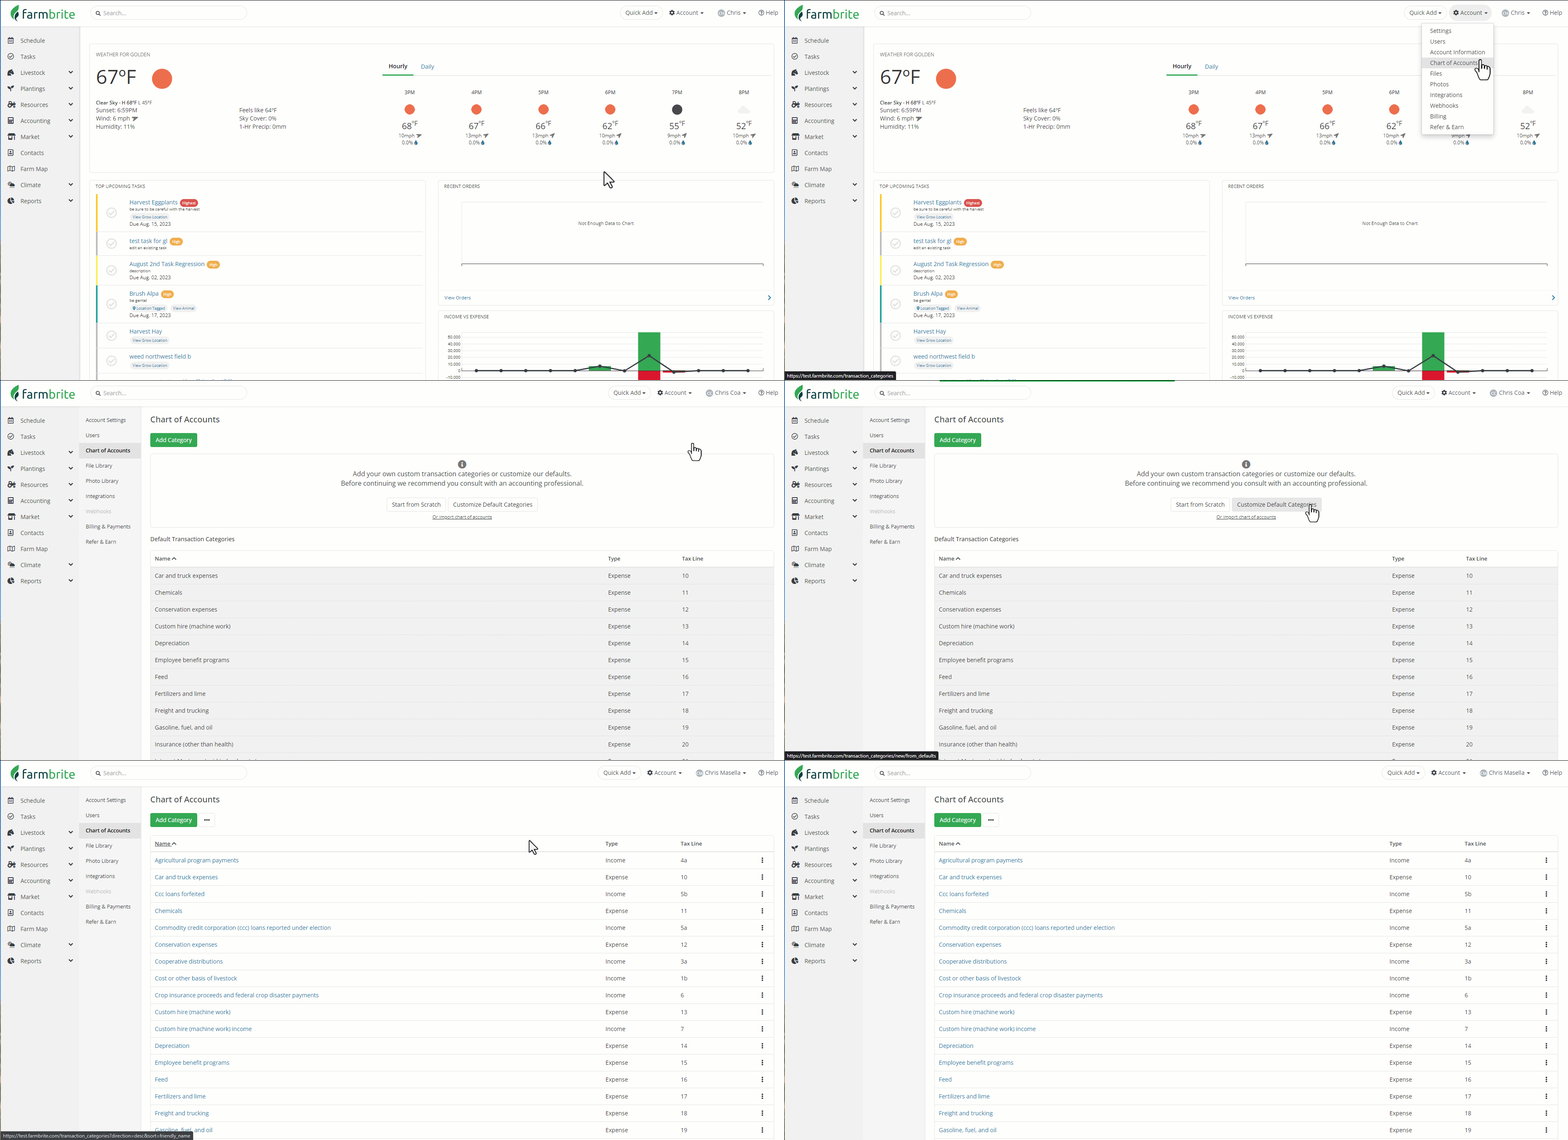
Did you notice how we filtered for just our Fertilizer and Lime expenses in the video above? Categorizing transactions classifies your income and expenses into separate buckets, helping you see where your money is being spent, and where your income is generated from. Farmbrite comes with default categories for you to choose from that are directly related to the United States IRS Schedule F Tax Form 1040. You select from these categories when creating transactions. You can also customize your accounting categories to be more aligned with your country, or your business operations. Accounting categories can also be connected in a parent/child relationship, allowing you to create subcategories and subtotals within a larger category. The example below shows you how to start customizing your chart of accounts, but be aware that this is not required; the standard categories are automatically available for you to use without this step.
These categories also play a major role in your financial reporting. We saw in the previous section that they're used in your accounting dashboard pie chart, and they are also critical for your Profit and Loss Statement, Tax Summary, and Spending by Category reports.
Creating Transactions
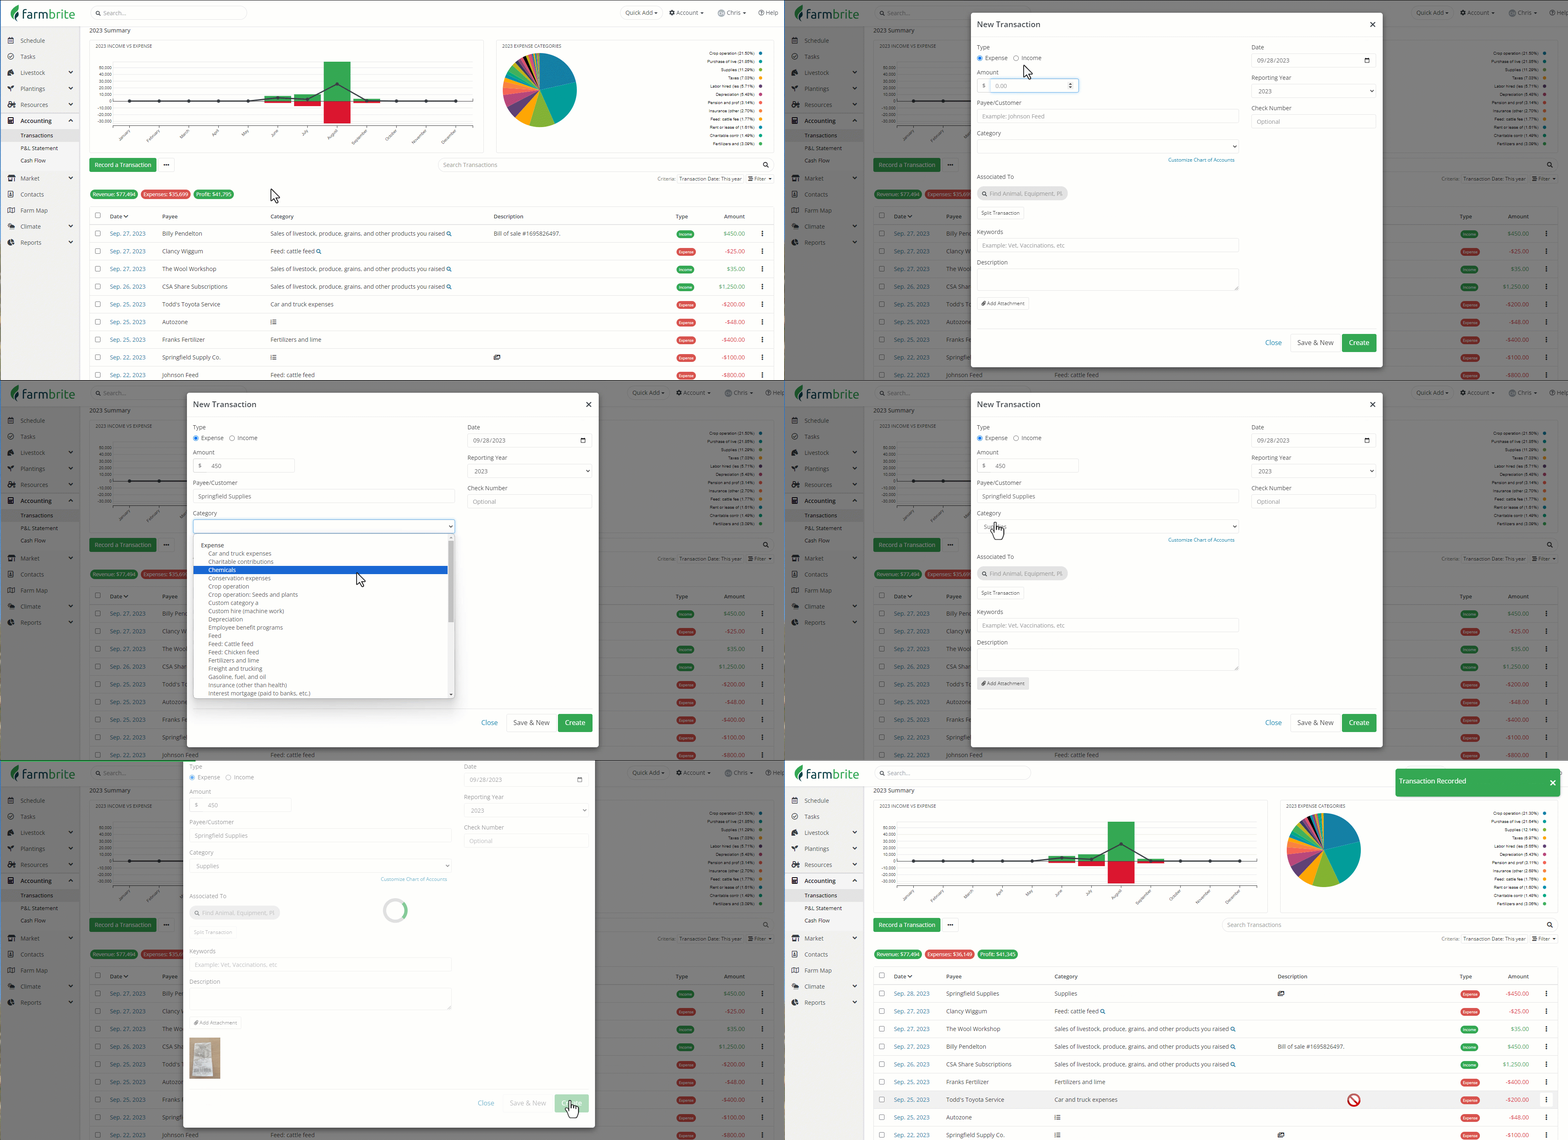
To get those helpful reports and all that dashboard data, you'll need to add your transactions to Farmbrite. You can do this by creating them right from the dashboard, or by importing them from a spreadsheet. Part of recording the transaction is associating it with a category as well, or multiple categories if you choose to split your transaction. In the example below we are recording an expense from a local supply shop so we chose the category "Supplies". You can adjust the date, add keywords, associate it with a particular record (animal, crop, equipment, etc.) and upload images associated with the transaction as well.
Accounting on Indivdiual Records
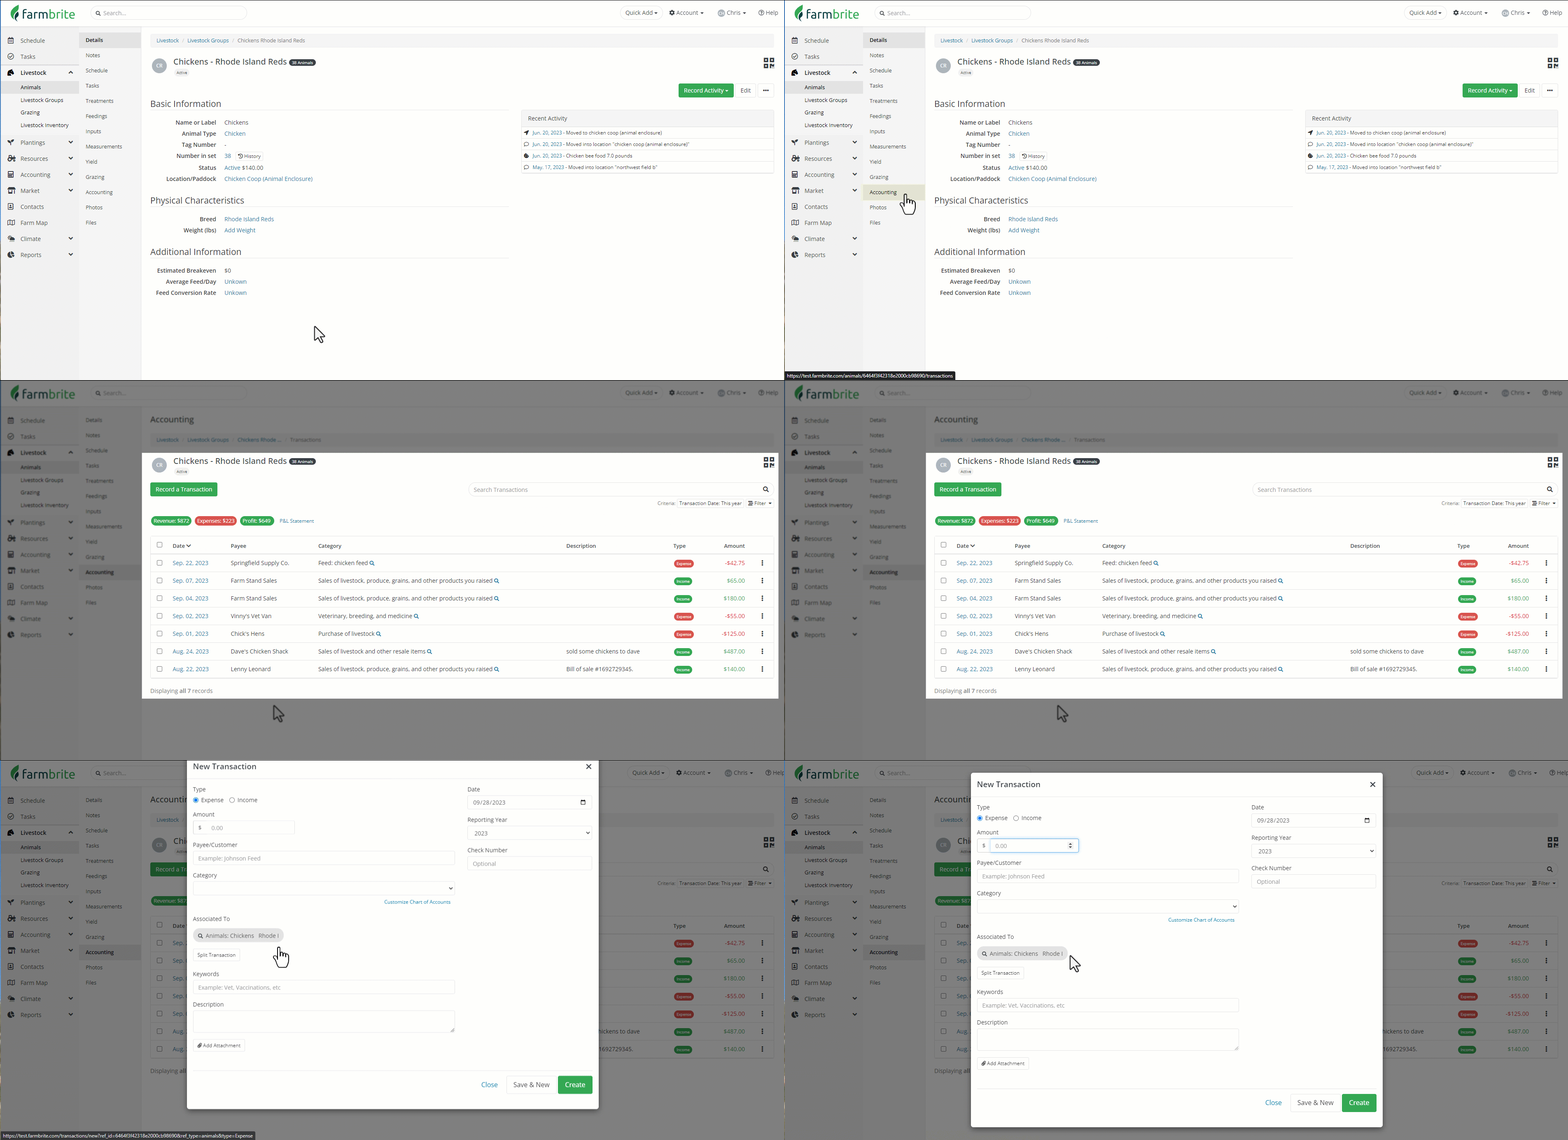
You also might create these transactions directly on equipment, market orders, livestock, or crop records to associate the income or expense with them. Each record has an accounting tab that shows any transactions associated with it. In the example below, you'll see our transactions that are connected to our chicken flock. If you create transactions from the main accounting dashboard and associate them with this record, you'll automatically see them here. You can also record transaction directly from here as well; the choice is up to you as both are displayed in these totals and in your reports.
Accounting Reports
You'll find multiple financial reports under the reporting section in Farmbrite. Each is outlined below, and linked to a more in depth article as well.
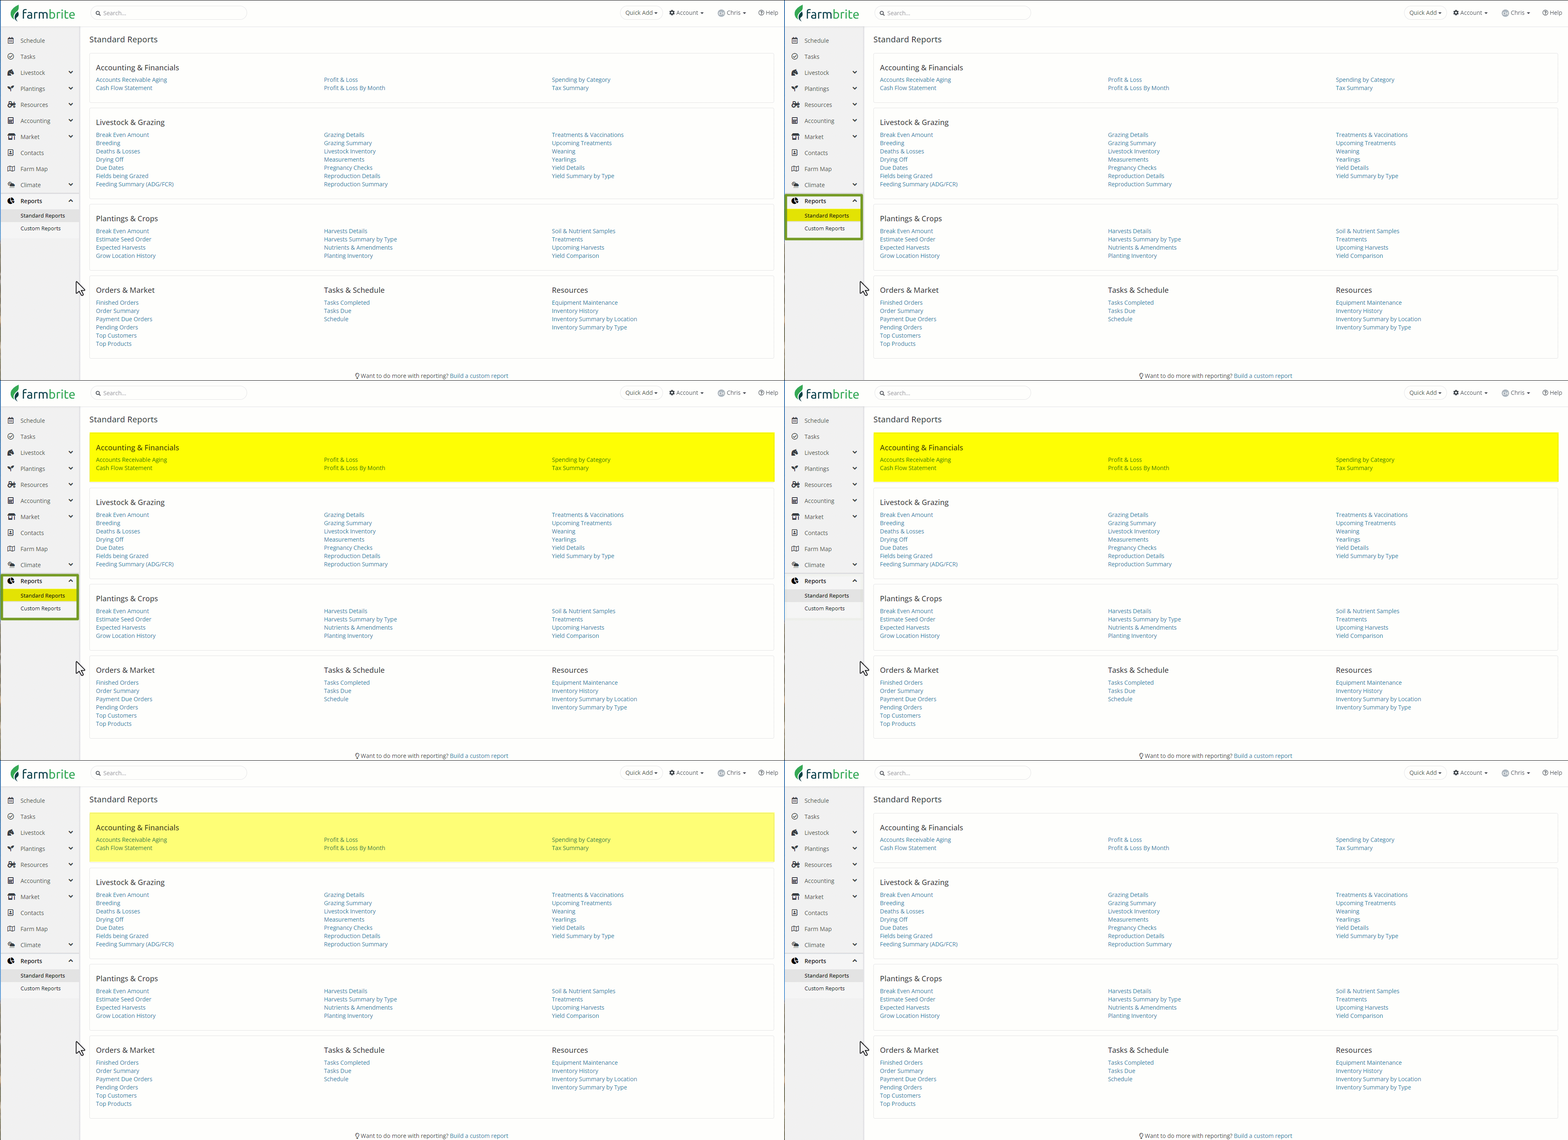
- Profit and Loss Statement - The categories that you use for your transactions translate directly to your Profit and Loss Statement. This report is a breakdown of your income, expenses, and profit for a specified time period. Like creating transactions, Profit and Loss Statements can also be run for specific fields, animals, equipment, and more to give you this information for a more granular piece of your business.
- Cash Flow - If you'd like to see a running total for you business finances that includes a previous period starting balance, you'll find the Cash Flow Report very useful. Like the Profit and Loss Statement, the Cash Flow Report will show you income and expenses during a given period to calculate a total. Beyond that, it will use all transactions prior to your start date to calculate a Starting Cash Balance. This gives you a running total for your business operations. If you're new to Farmbrite, you can add your beginning cash balance as a single transaction to still get the benefit of this report.
- Tax Summary - Similar to the Profit and Loss Statement, but based on the tax lines associated with your categories. If you're using the default categories this report will correspond to your Schedule F tax lines, and if you've customized your chart of accounts it will use the tax lines you defined. Note that you can have multiple categories combined into the same tax line if you define the same tax line in multiple categories.
- Spending by Category - This report uses your standard or customized expense categories like the Profit and Loss Statement, but shows you detailed transaction information within each category. Note this is just for expenses, and not income transactions.
- Accounts Receivable Aging - This report is specific to market orders; it shows you who still owes you money for orders that you have processed, with different timeframes for the duration of the outstanding balance.
- Looking for more? You can also create custom reports for your Transactions which allow you to add the specific data you'd like to see to a report.
Make sure you check out all the linked articles in each section above. You'll be on your way to easier bookkeeping and financial know-how in no time! If you don't find what you're looking for an still have questions, feel free to contact us; we're always glad to help.
Farmbrite recommends that you work with an accounting professional for any questions specific to your business accounting. They can help ensure compliance with your local laws and offer advice on how to best account for your business needs.
