No matter what you're growing, how you're growing it, or where you're located, the weather is going to have an impact on your agricultural operation. Even if you are growing hydroponically in a controlled environment greenhouse, cloud cover and outdoor temperature might still affect your crops. Out in your fields, the precipitation mother nature provides (or doesn't!) will have an impact on your irrigation schedule. The humidity, temperature, and amount of sunlight will absolutely impact the quality and quantity of your harvest. Beyond your crops, the weather affects your livestock too. Did it get too hot in the chicken coop and have a a negative effect on egg production? Are you cows dripping wet after a cold rainy day, leaving them more susceptible to respiratory illness? There are so many variables to account for with such far reaching impacts on your operation.
Because the weather is so critical to your business, you likely have all sorts of technology to record weather data. From thermometers and hygrometers to light sensors and rain gauges, using a weather station can help you prepare for unique scenarios and react to changing conditions and historical trends. We know that data can sometimes be hard to read and capture though, so we've created an entire subsection of Farmbrite devoted to recording and visualizing climate data trends at your farm. You'll find it under Climate in the main menu.

Weather History and Maps
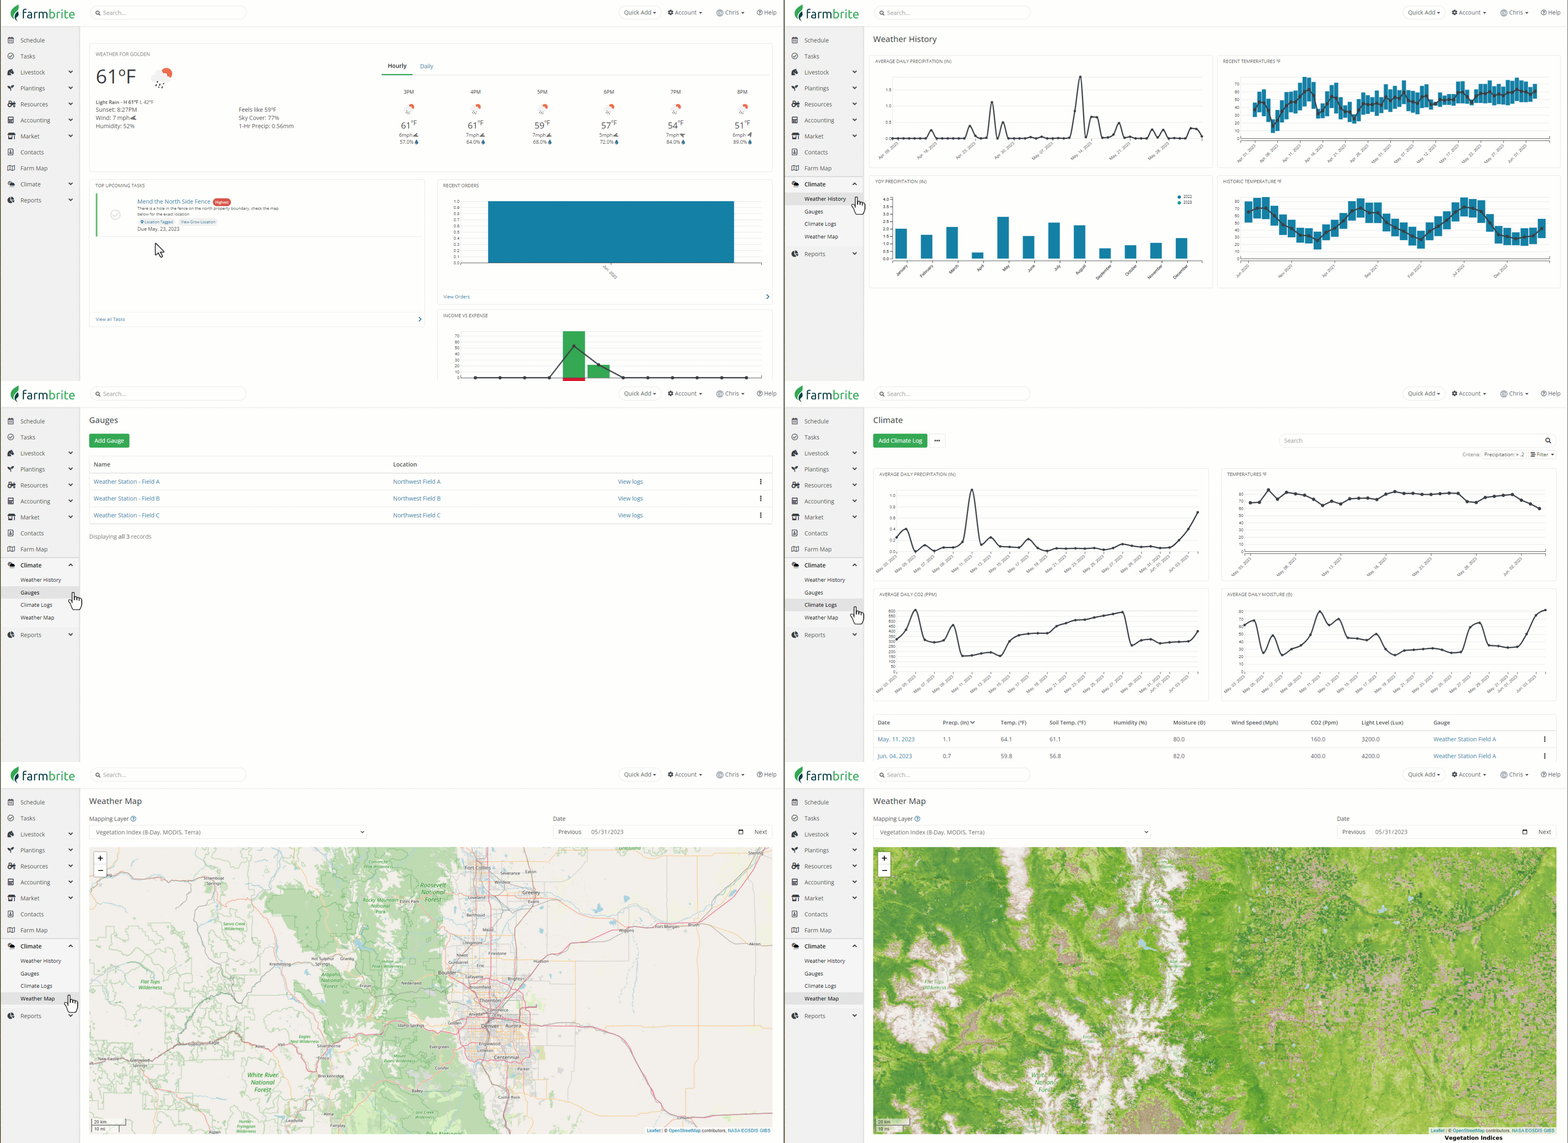
Even without recording any of your own data, you'll find the Climate section immediately useful as it comes preloaded with data from the USGS, National Weather Service, and NASA for you to review and gain insight from. These are shown under Satellite Maps and Weather History.
You'll find charts on the Weather History tab showing average daily precipitation, recent temperatures, year over year precipitation, and historic temperatures. These easy to access charts display the most relevant and critical information at a glace. You'll still have your weather forecast on your Farmbrite dashboard to look to the future, but if you want to study the past you've come to the right place.
The Satellite Maps tab (formerly Weather Map) is a bit more in depth, with dozens of overlays for all kinds of important and interesting data. While the weather station in your southwest paddock provides excellent localized data, sometimes you might want to harness the power of NASA and NOAA satellites and zoom out for a more expansive view. From this page, you can select map overlays for temperatures, vegetation, soil moisture, precipitation, and more. This data is sourced from various sites; check out NLDAS, MODIS, and Noah LSM for more information on them. Be aware that not all data is available for all locations on all dates.

Creating Gauges
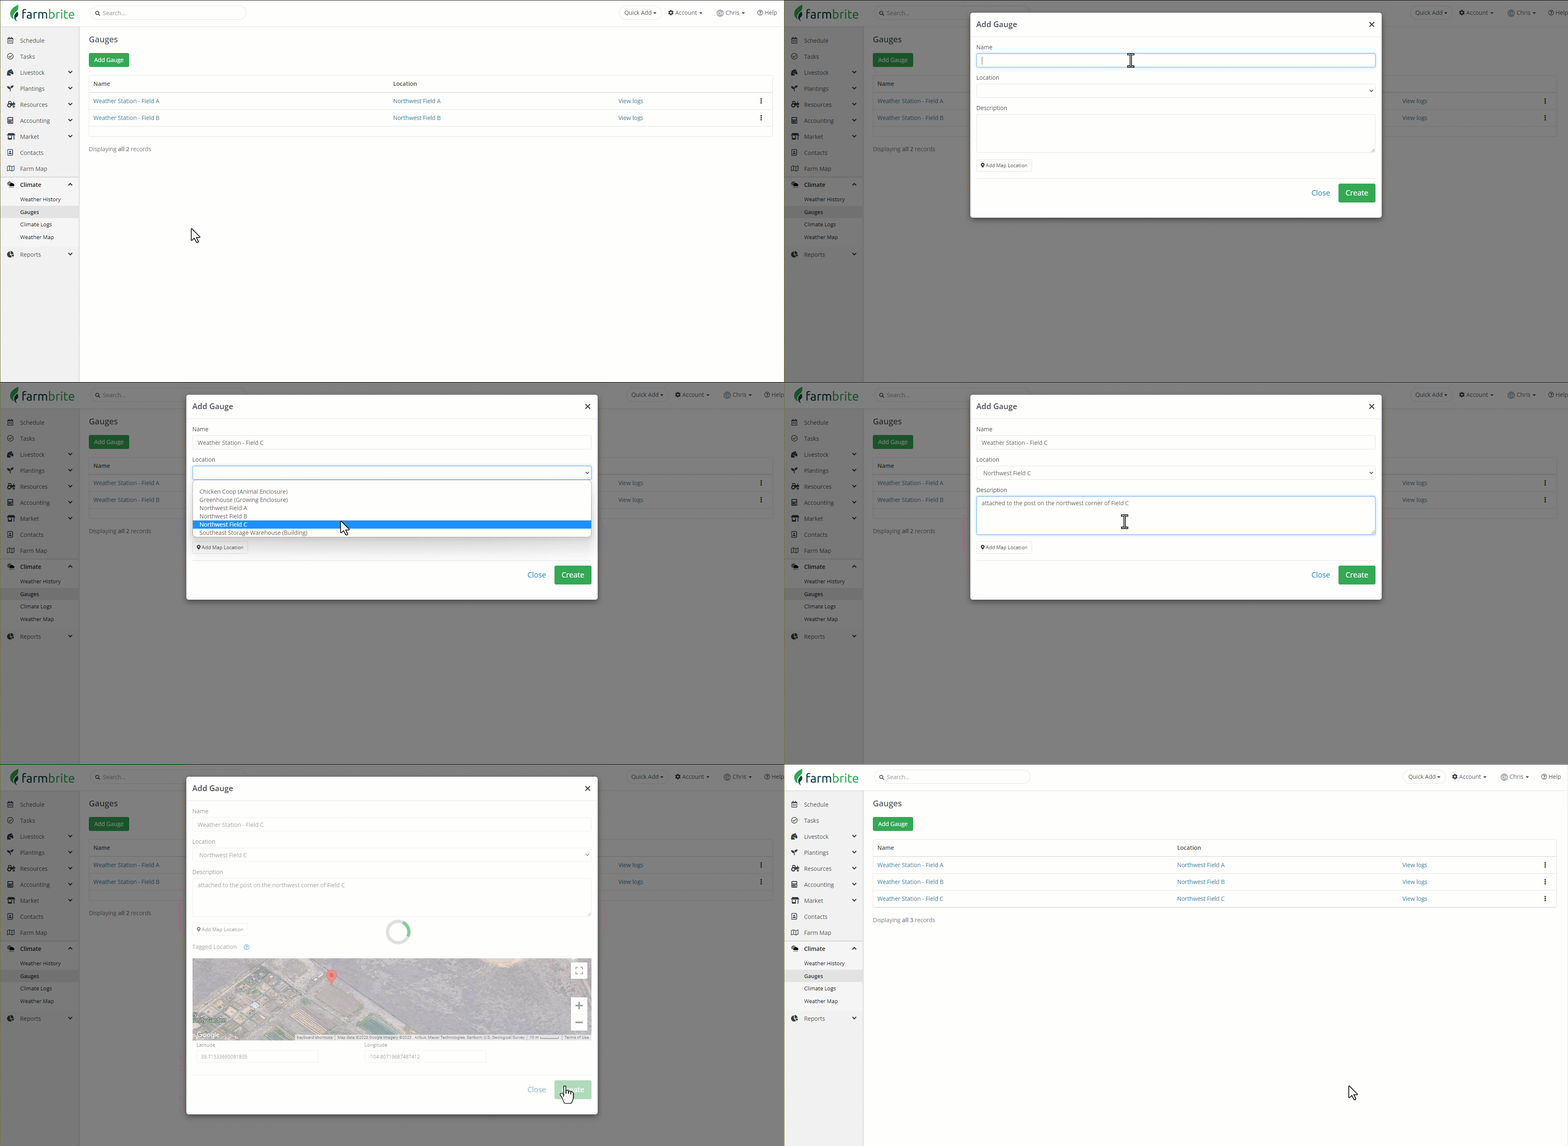
NASA can certainly give you informative insights, but that rain gauge mounted to your southwest barn or the thermometer in the chicken coop can also be extremely helpful for your own unique operation. That's why we allow you to create your own sources of data, and record logs for them. You can associate these gauges with animal enclosures, growing enclosures, fields, and buildings. This lets you track different data in different places, and then draw correlations to it's effects on your livestock and crops. This section is totally customizable; you can define a name, location, description, and even GPS coordinates for each gauge. Each gauge has the ability to have unique logs, with charts and graphs displayed individually, or averaged with your others for a comprehensive view.

Recording Climate Logs
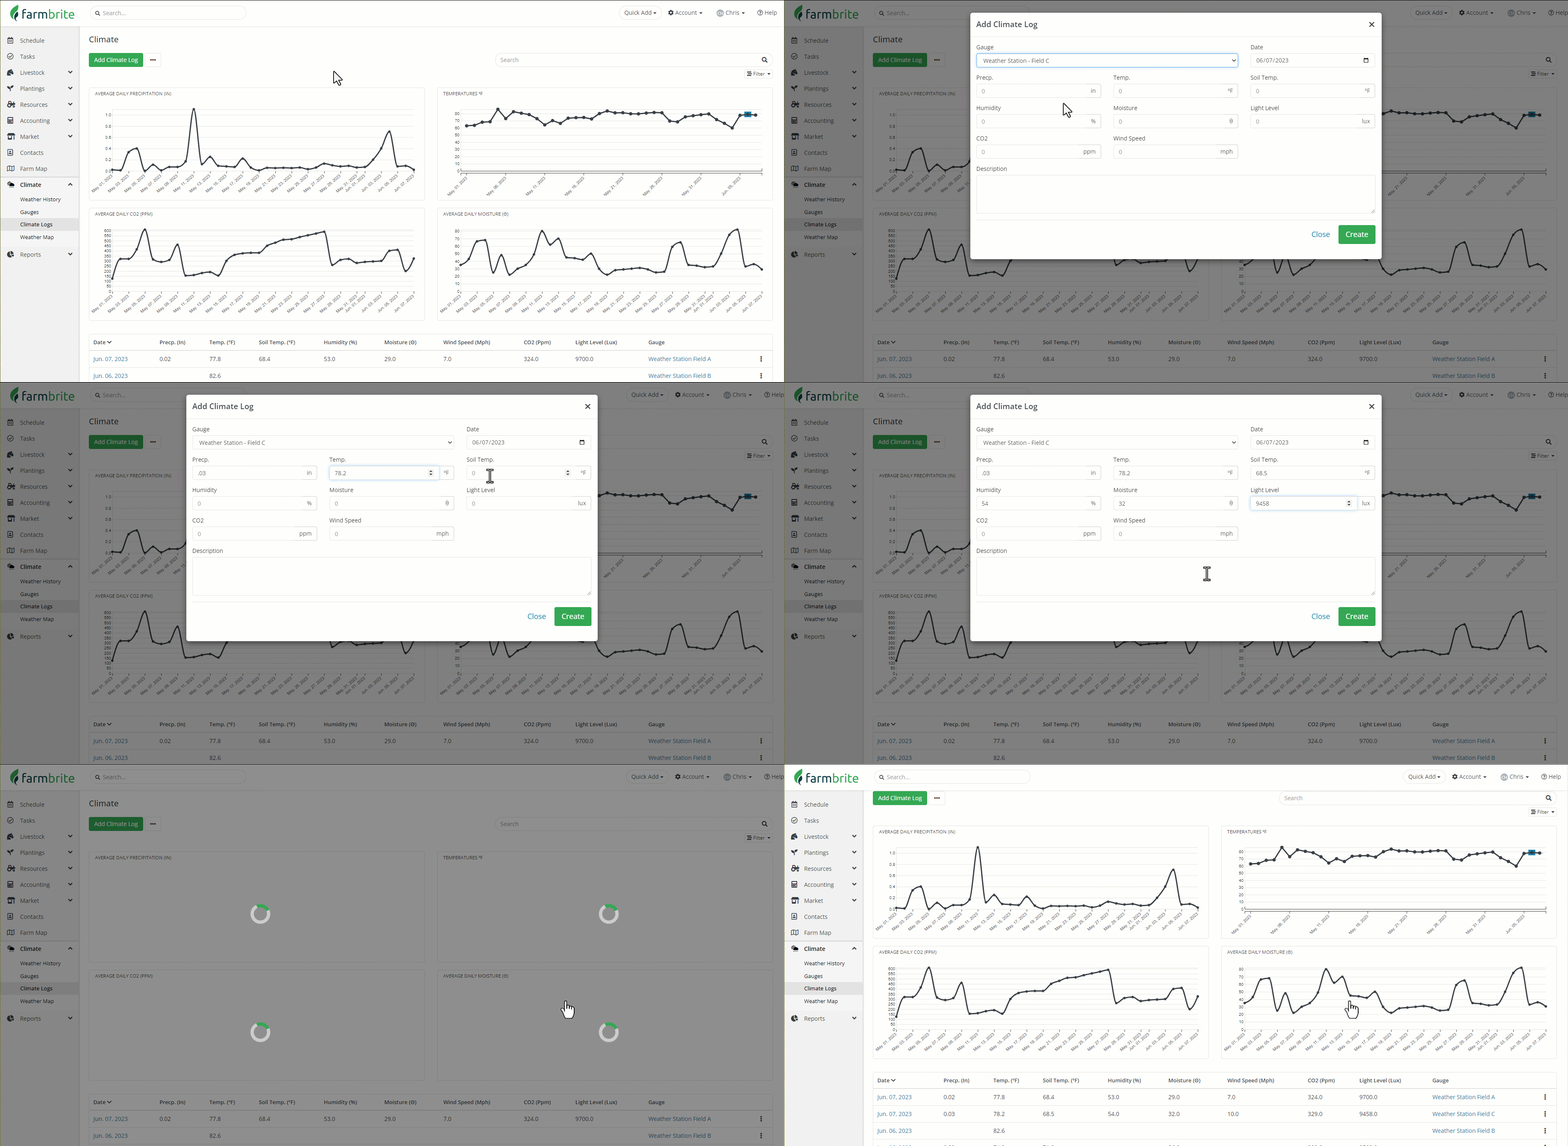
When you want to get your weather gauge data into Farmbrite, you'll create Climate Logs. Each log is associated with a date and a gauge, and tracks the following data points:
- Precipitation
- Temperature
- Wind Speed
- Humidity
- Soil Moisture
- Soil Temperature
- Light Level
- CO2
None of these are required; you can track what is important for you and your operation. Add them everyday, once a week, or whenever works for you. You can also import them to get your past historical data in Farmbrite, or maybe your weather station allows for a spreadsheet download of captured data for you to enter. And if it integrates with Zapier, you can even set up automated records to be created.

Now that you have a good foundation for getting started with the Climate system, move on to other articles in this section to learn how to set up your gauges and record your climate logs.