Farmbrite works with many different types of livestock and farm operations. Our customers are diverse, raising different animals and producing unique harvests in different locations all around the globe. We've designed dozens of standard reports that are helpful to most of our users, but we know that business needs vary, and customization is critical to successful operations. Because of that, we offer a comprehensive custom report builder that lets you select exactly what you want to see on your report, so you can find just the data you need without anything you don't. The goal here is flexibility; we want you to get what you need.
Building a custom report is a 4 step process, and Farmbrite walks you through each step with a report building wizard. To start, navigate to Reports in the main menu, and choose Custom Reports. You'll see a list of any previously created Custom Reports you can run, and the option to create a new report.
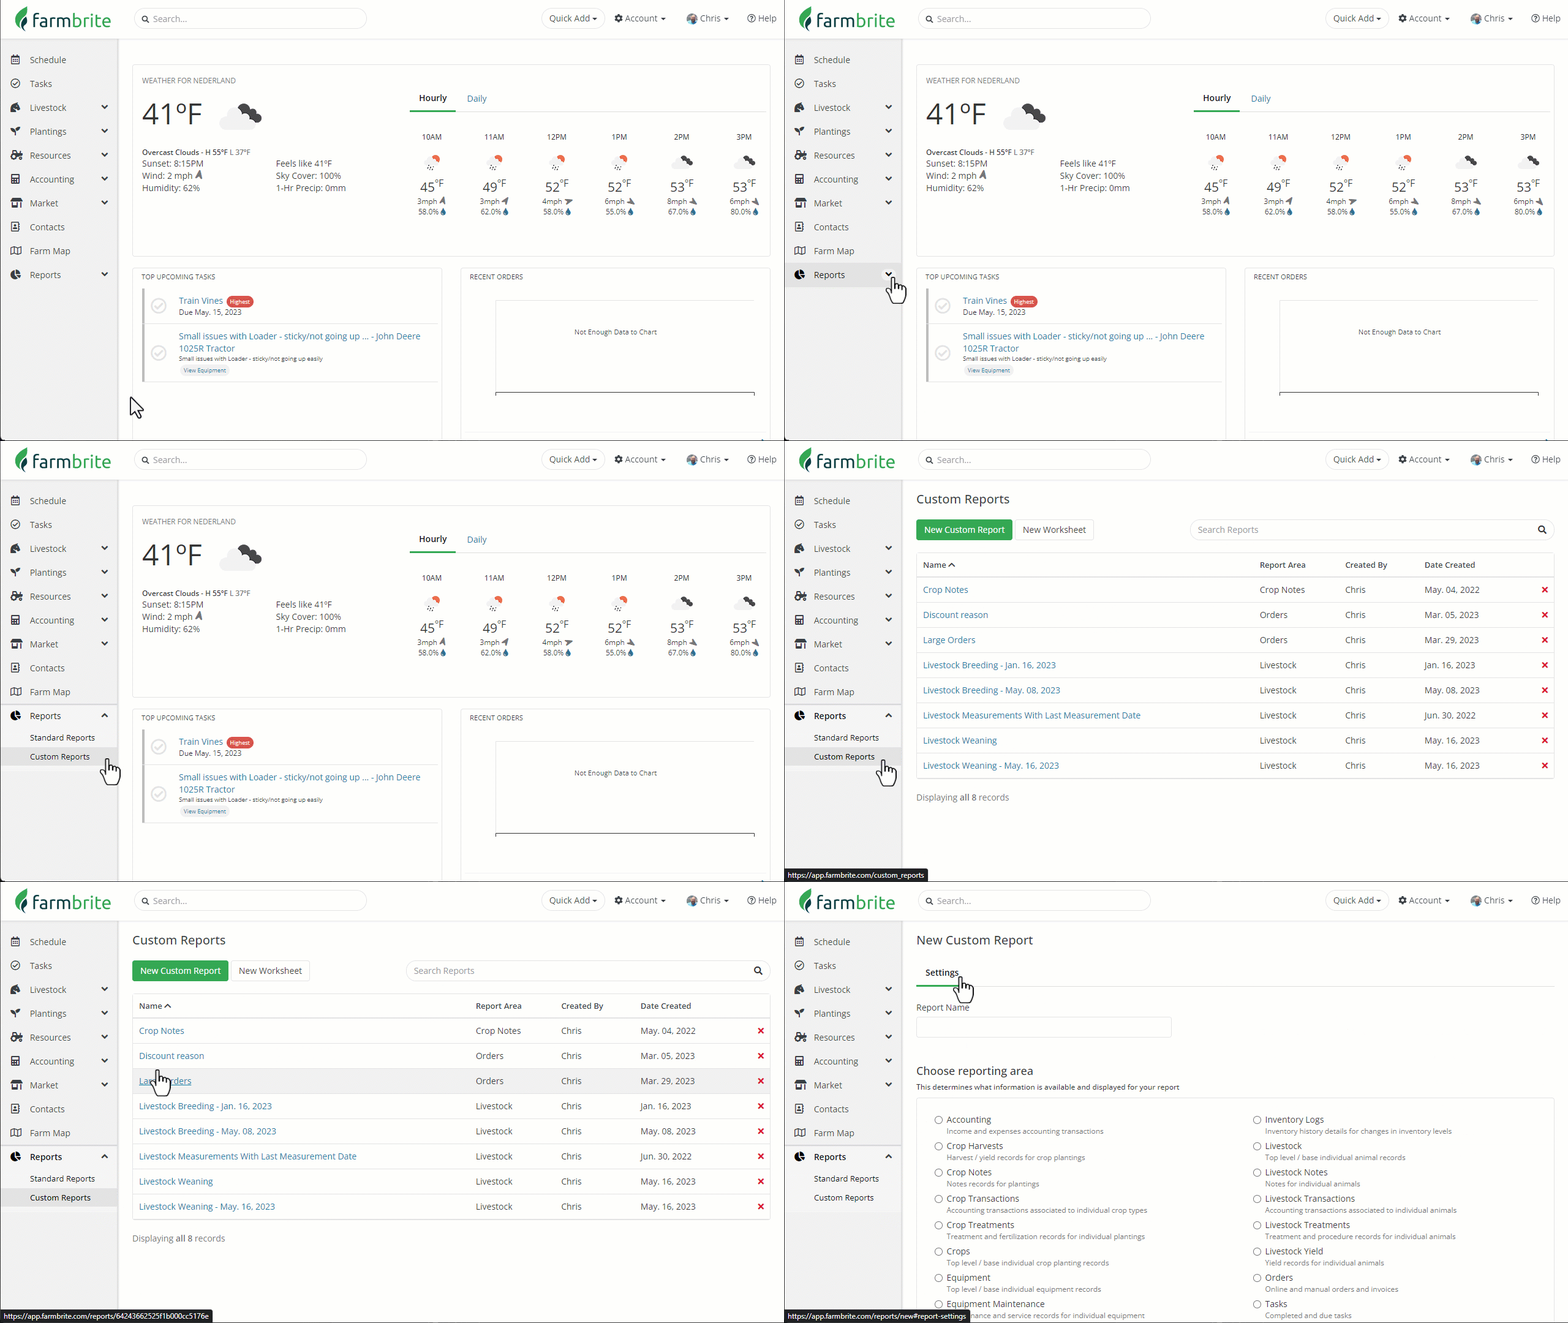
You'll first be asked to configure your Report Settings. You need to give the report a name, and then select a section of Farmbrite to report on. You'll have multiple selections for crops and livestock; you can report on Notes, Transactions, Treatments, Harvests/Yields, and the animal records in general. You could also choose to report on Orders, Tasks, Inventory, Equipment, or your Accounting needs. Each section includes a brief description of what you can expect to see on the report.
You can only choose one here; select the one you'd like to use, and the wizard will prompt you to move to the next step to select your columns. In our example we're going to build an Equipment report that includes maintenance information and current equipment status.
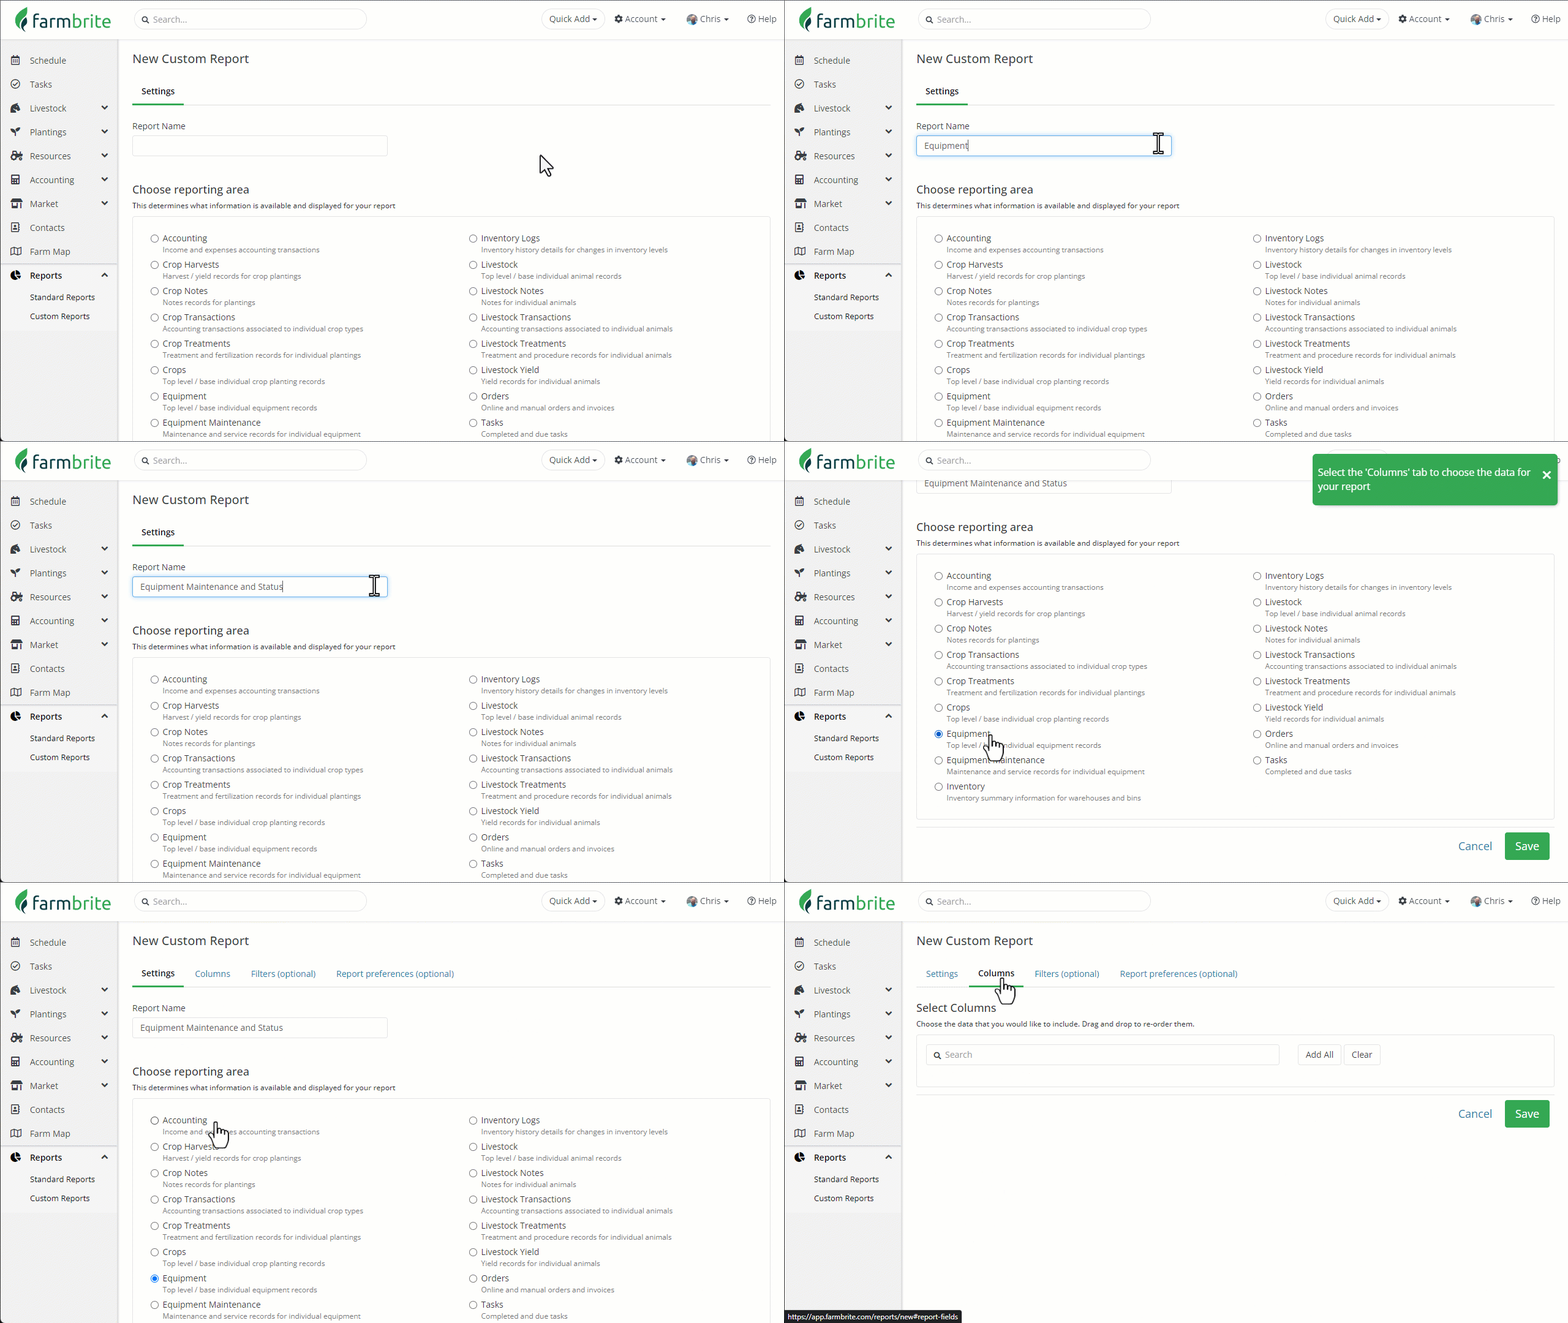
Step 2 lets you choose what data to include on the report. The fields you can add differ based on the report type selection you made in the previous step. For example, the fields in the Crop Treatment reporting area would include things like treatment date, treatment type, and retreat date, while the Equipment reporting area would have fields like model, brand, and serial number.
When you click on the search box, a list of all available fields will be shown. You can type in the box to look for specific fields, or scroll through the list to see what's available. You could also add or clear all fields using the buttons to the right of the box.
Once you've added fields, you can drag and drop them to reorder them. The order they are shown on this page will reflect as the order they are displayed as columns on your report. Think of this like a spreadsheet, the first field is column A, the second field is column B, and so on. We moved Status to the second column in our example below.
If you mistakenly add a field you didn't need, click the red X on the right to remove it.
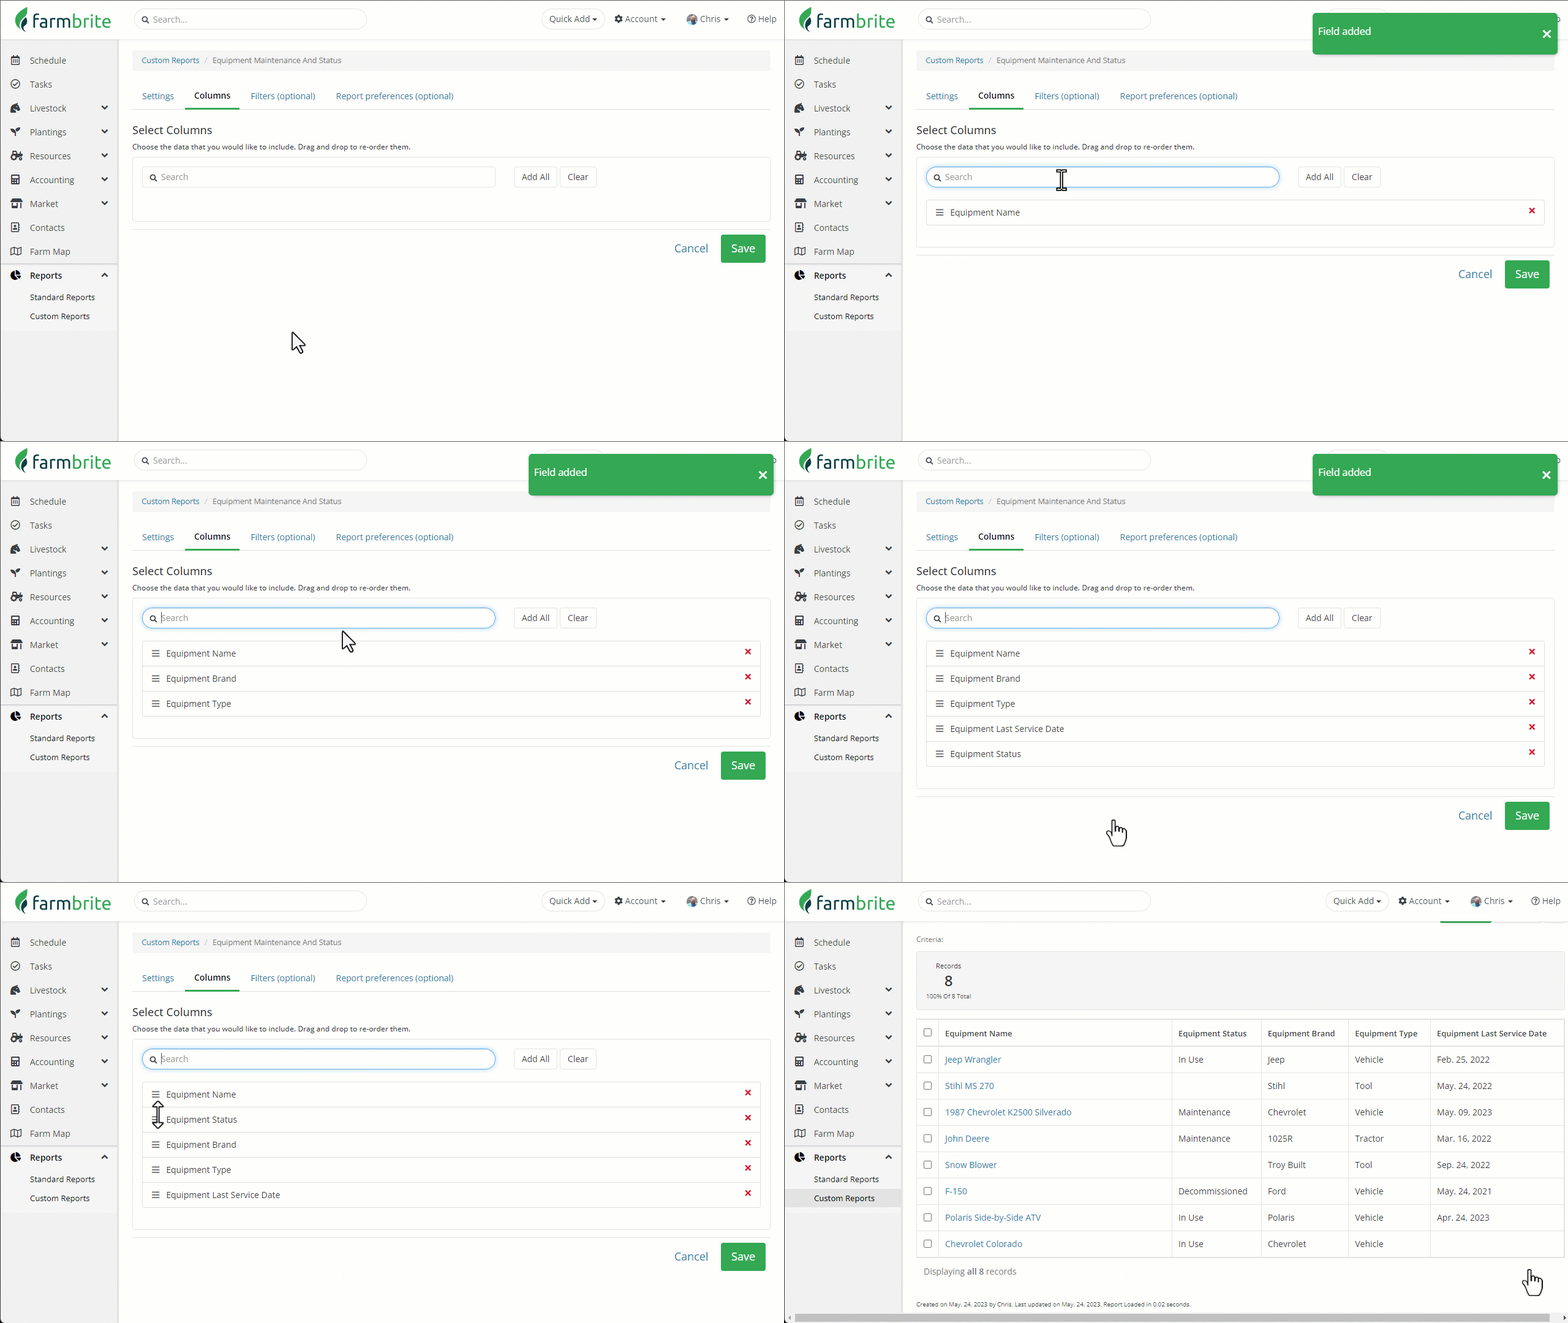
The next two steps are optional. They will help you find the specific data you are looking for and control the way the report is displayed, but if you just want a basic sheet of data, you can click Save and the report will generate. Check out our result in the image above; it's pretty basic, so we will click Edit and then move on to the next two optional steps.
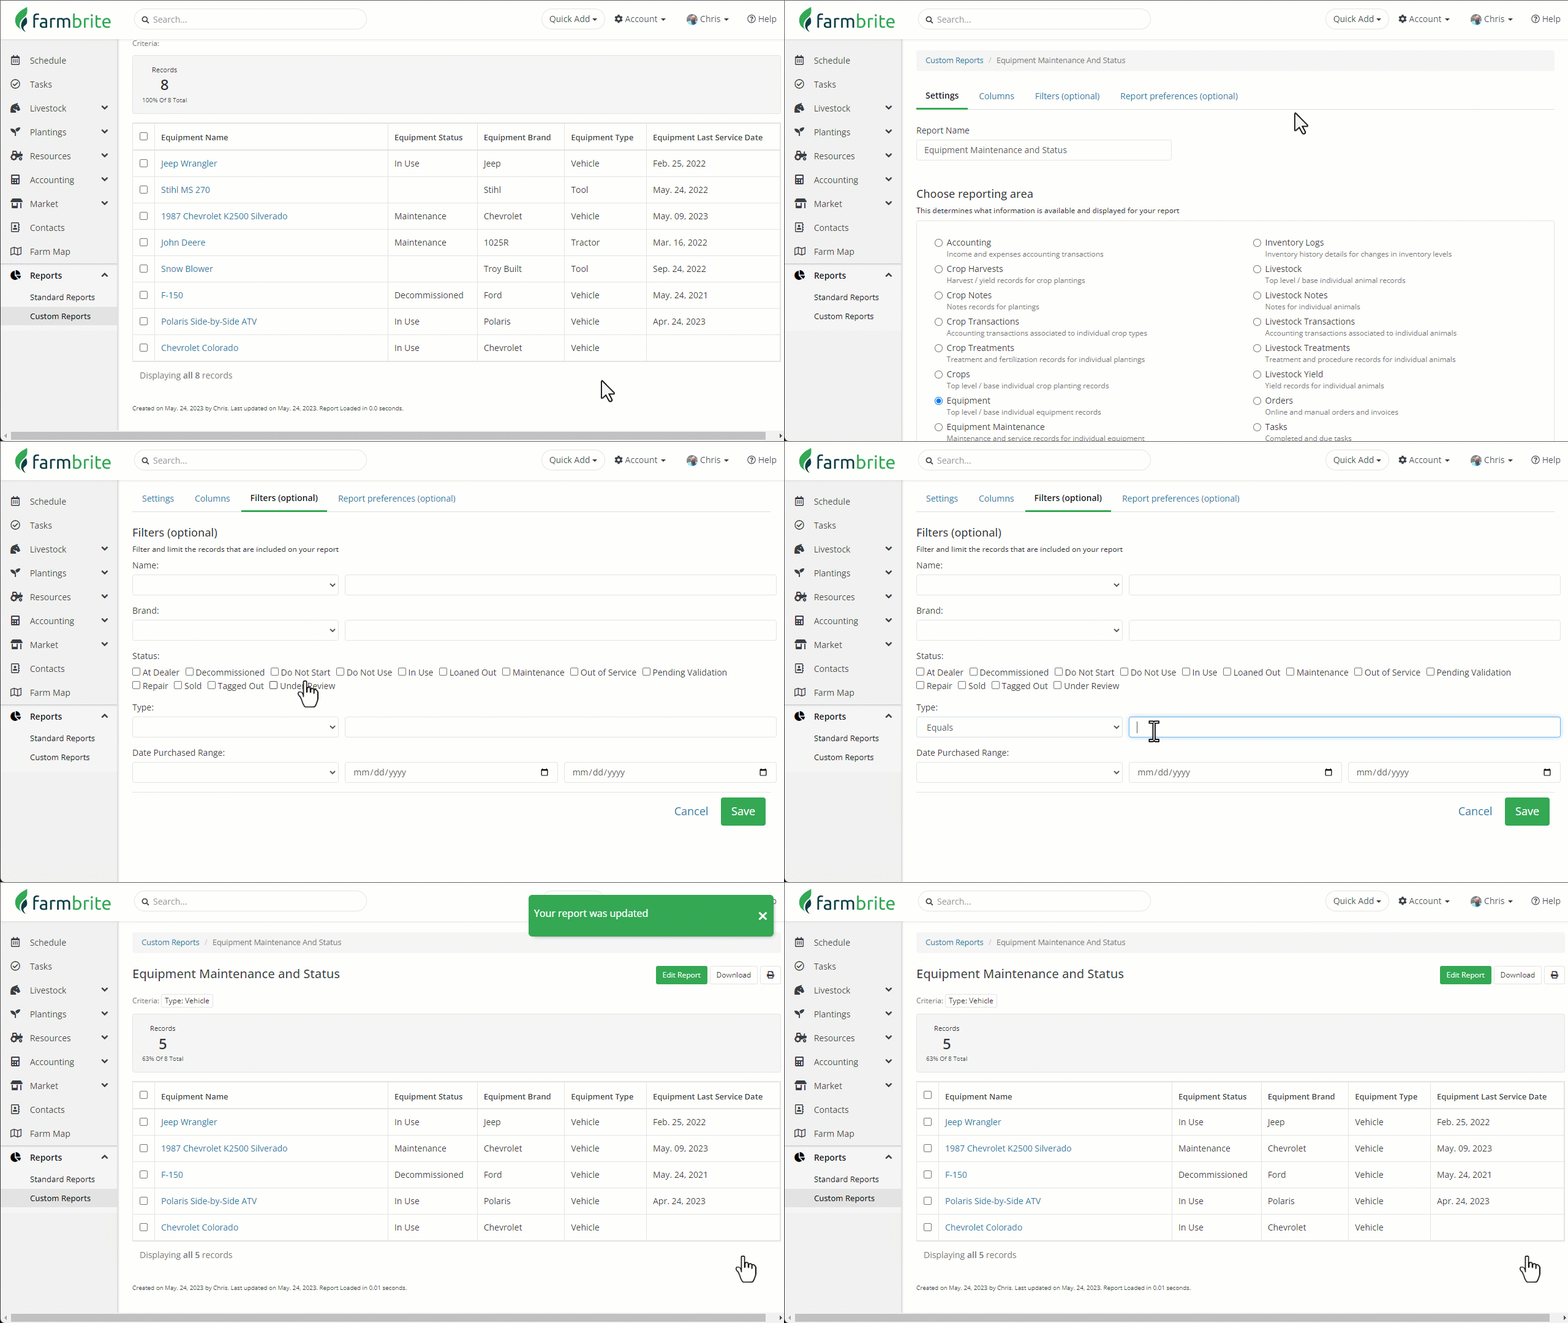
Step 3 lets you filter this report. We created a report for our Equipment, but do we necessarily need the chainsaw, tractor, and snowblower in the report mixed with our pick up trucks and side-by-side ATV? We can put additional filters on the report to only returns results that we need.
For our Equipment report example, we can filter by name, brand, status, type, or date purchased. However, these filters are different based on the reporting area. For example, if we were creating an Accounting report, we would see filters like Transaction Type, Payee, Transaction Date, etc.
For our Equipment filter, we will set that Equipment Type equals "Vehicle". This will remove the tools we did not want to see. Note that you could also use "start with" or "contains" as filters as well to expand or limit your search results.
Step 4 has you set up report preferences. This includes things like how to order and group the data on the report, or choosing to display it visually as charts and graphs as well. There is so much you can do here! In our example below we have sorted the records by the equipment's Last Service Date, and included charts for brand and status. Now we can easily see what might need maintenance and what it's current status is.
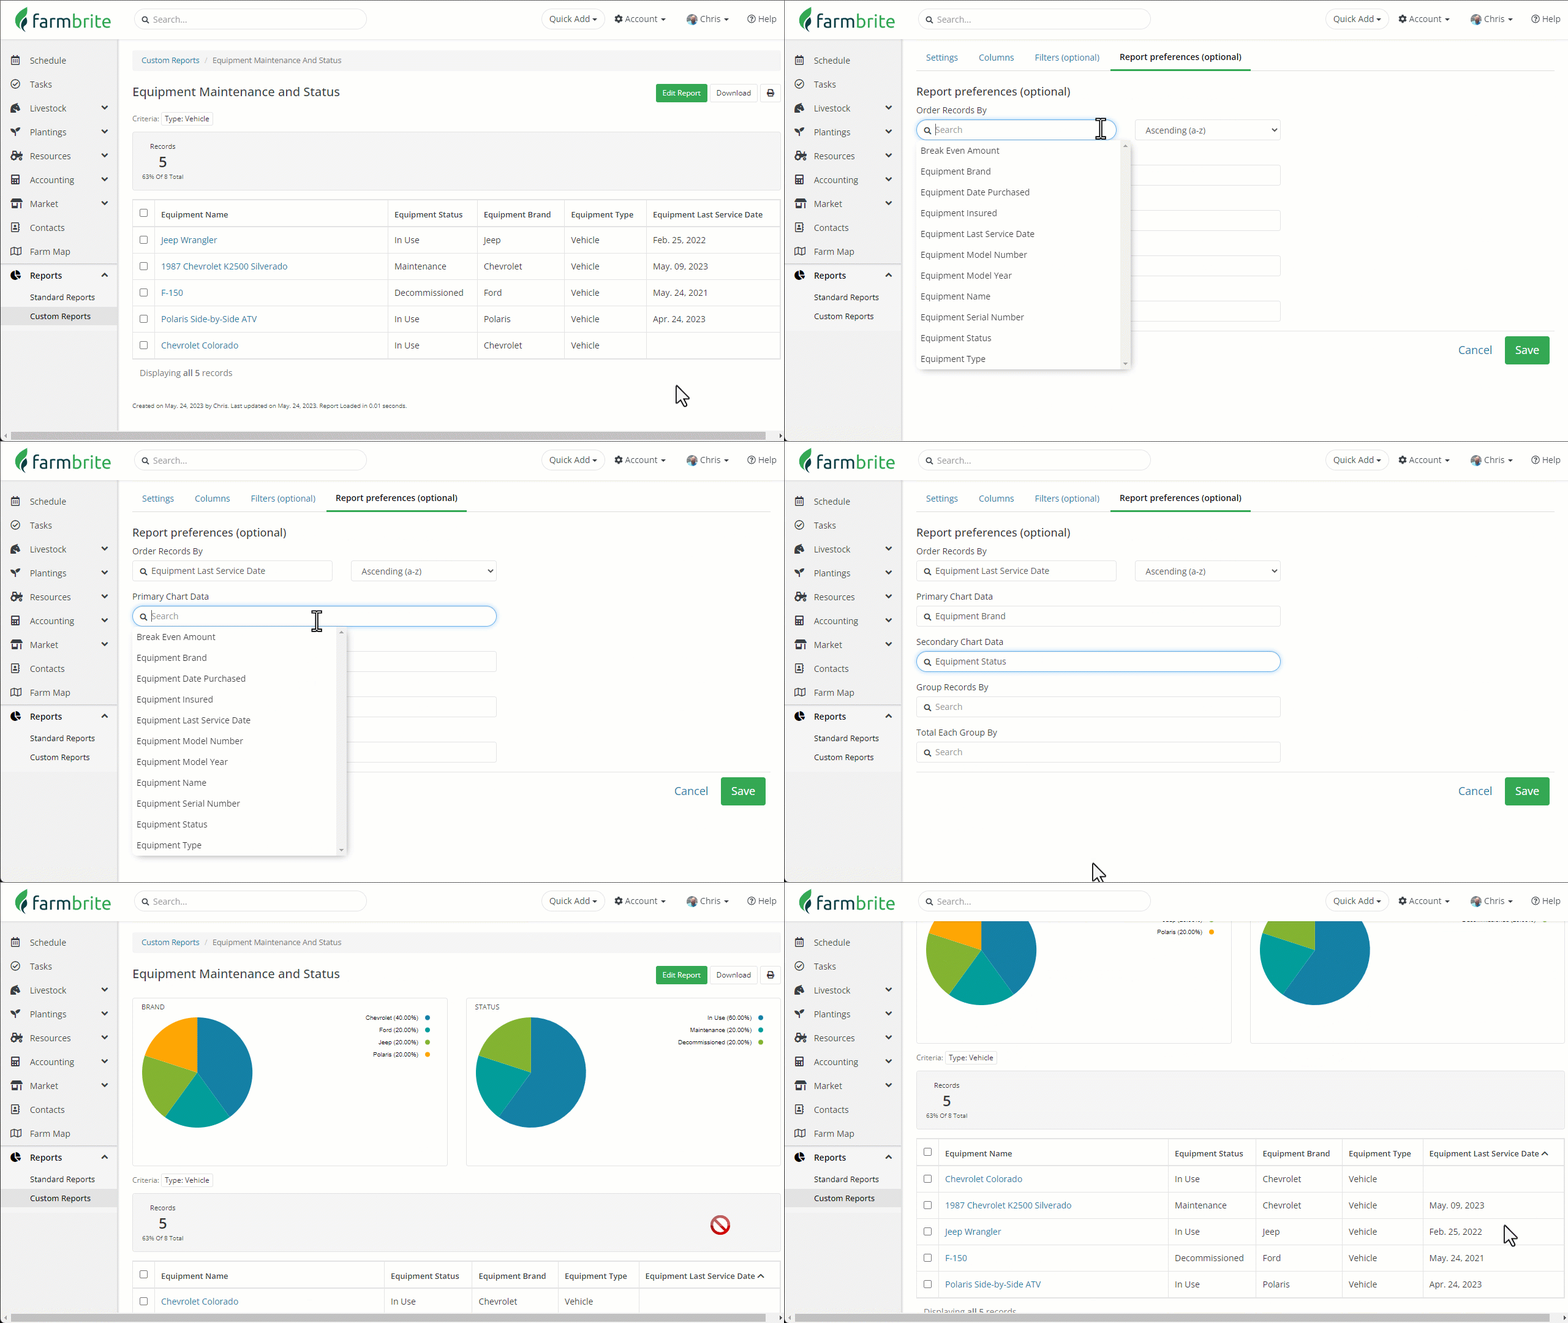
OK, now you've got the basics. You can choose your reporting area, add your columns, filter to limit your results, add charts for a visual appeal, and sort your report in the order that works best for you. Now let's take our equipment example a step further. What if we did actually want to see those tools from the original report (the snowblower, tractor, and chainsaw), but we just needed them separated? Well, we can use the Group By feature to make sections within the report. In our example below, we've removed the filter for Type = Vehicle, and now selected to Group By Type instead. Our results are now divided into subcategories representing each different type of equipment we have.
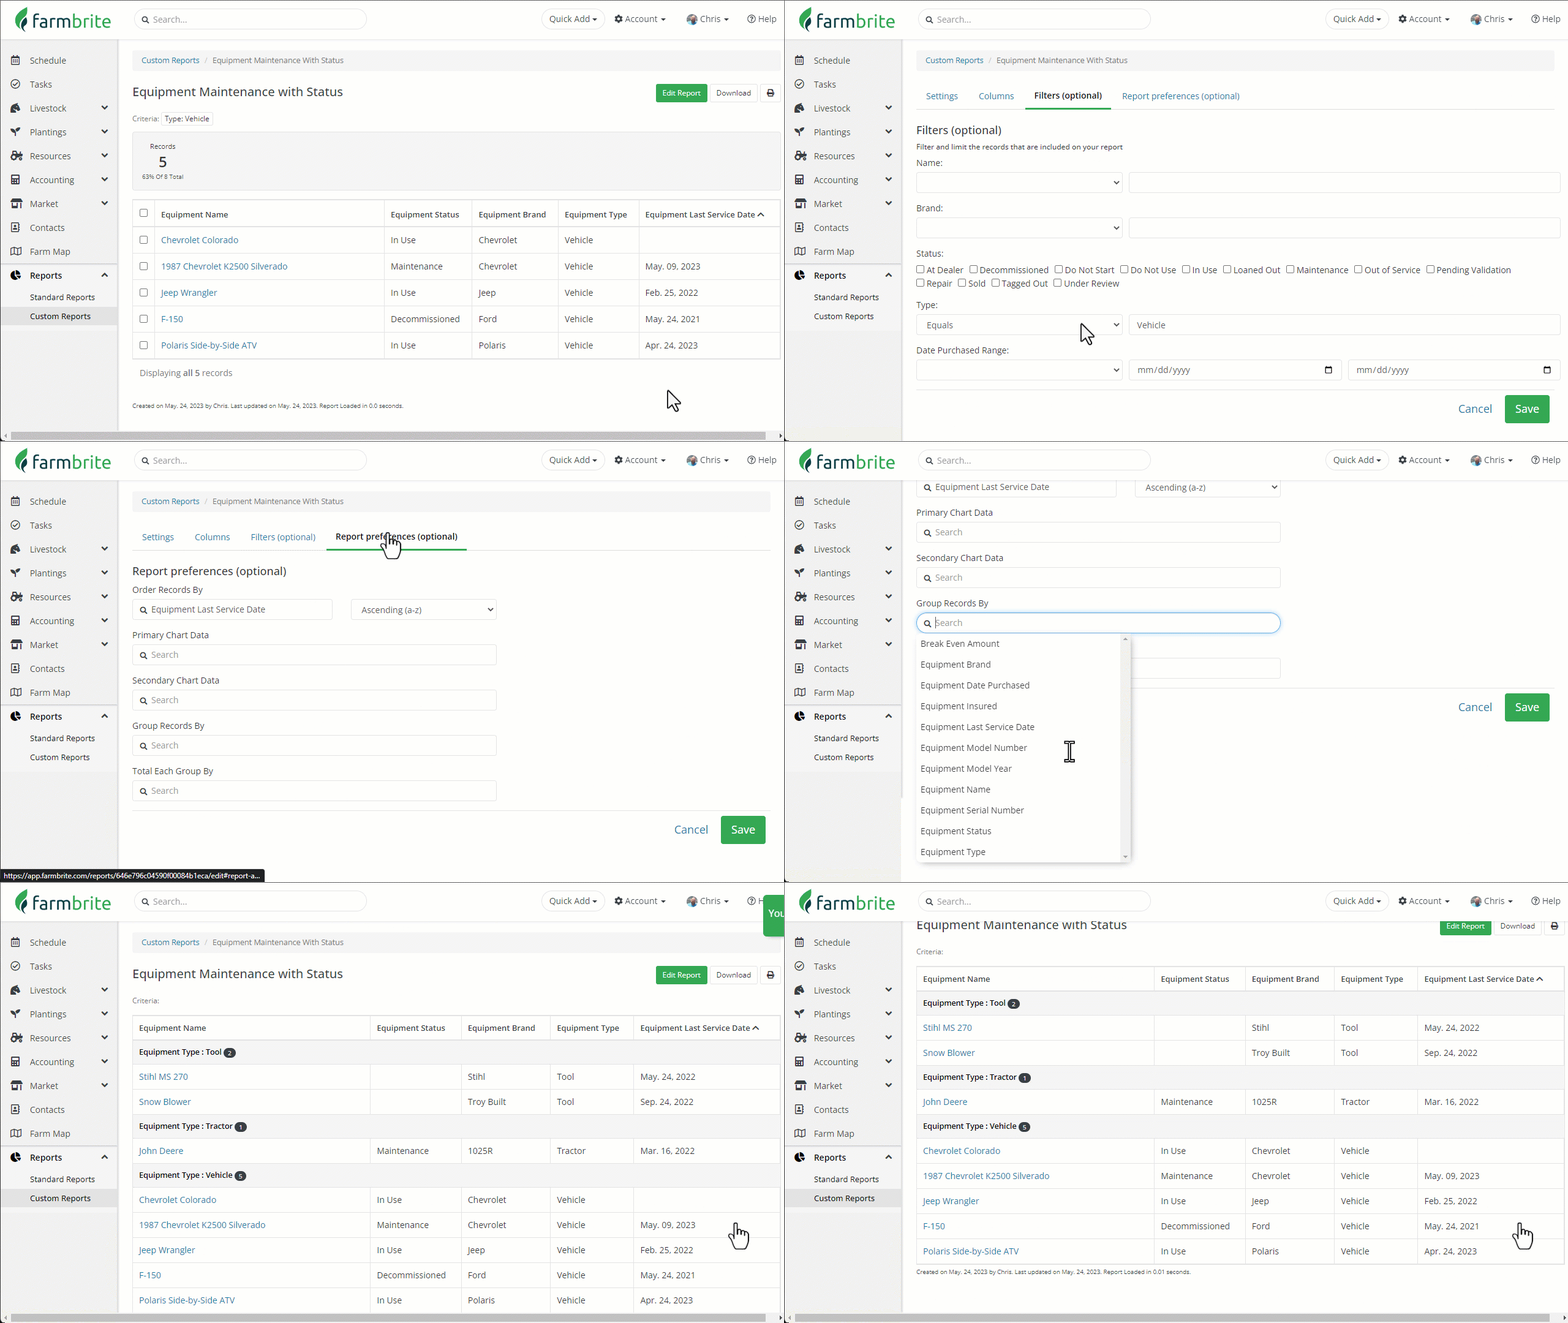
No matter what filters, groups, or data you include, you can always download or print the data using the buttons in the upper right of the results page.
And now it's your turn! Go ahead and make some reports, and feel free to reach out if you have questions. Or just drop a line and let us know what you made, and how you're using it. Maybe it's something that could benefit other Farmbrite users that we could turn into a standard report, with kudos to you, of course!
Note: Farmbrite reporting data may be delayed up to an hour when compared to records you've created. If you have recently made updates but don't see them reflected on the report, give it some time and you'll see them soon!