Spending by Category Report
In your Farmbrite account, you have access to many types of reports; reports that we have created for you, reports that you can create, as well as charts and graphs through the software that also gives you reporting data. These reports are there to help you more clearly see how your business is doing, get accurate data on your production, and be more organized. The Spending by Category report is one of these reports.
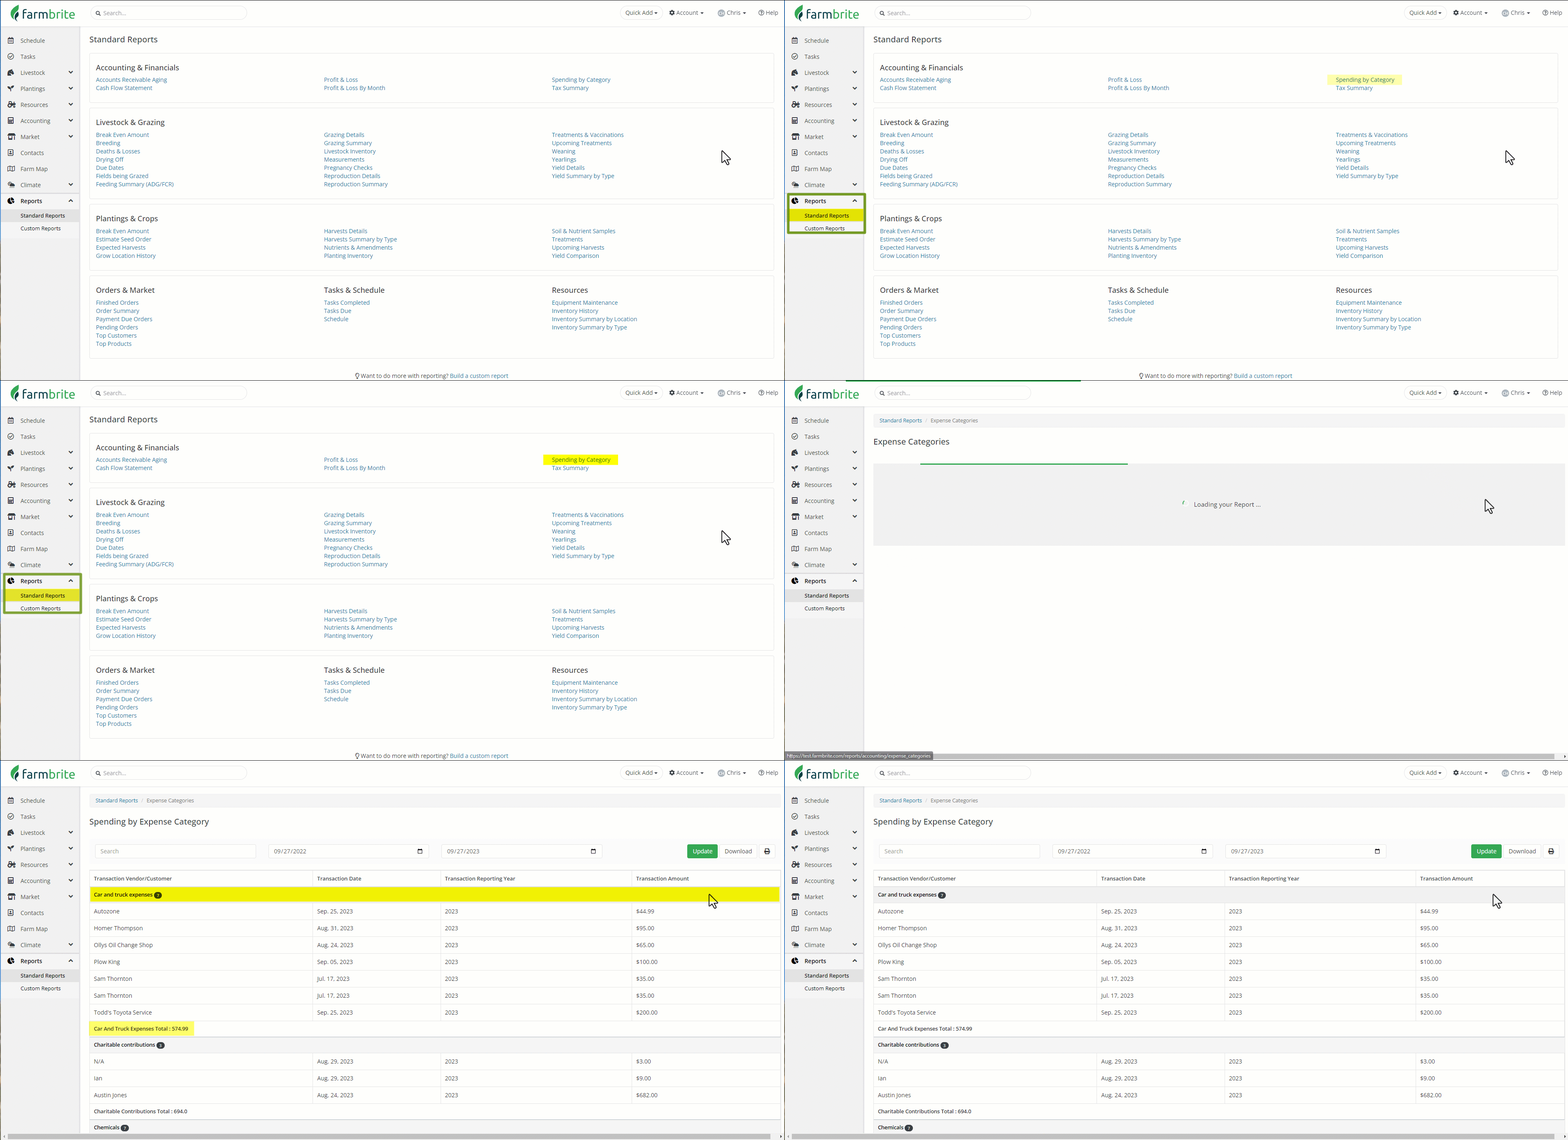
Similar to the Profit and Loss Statement, the Spending by Category report will categorize and total your expense transactions. You can find this report under the Accounting & Financials section of the Reports tab.

In the report, you will find a row header that shows totals for each of your spending categories. Like in the image above you can see the highlighted section, Car and Truck Expenses.
This report shows you transaction dates and years, as well as amounts while being broken down into sections for the different categories. This report provides more detail beyond just the category; you'll see the individual transactions within each category with their details like dates, amounts, and who you paid. This helps you see where exactly where your biggest expenses are, and who they are paid to, within each category.
By using the filtering you can also sort the data into specific months or time periods that you would like to manage or see the information in a specific way.
Overall, this report can help you see where exactly where your biggest expenses are, and who they are paid to, within each category.
If you have any questions about this please let us know.
Farmbrite recommends that you work with an accounting professional for any questions specific to your business accounting. They can help ensure compliance with your local laws and offer advice on how to best account for your business needs.