Getting Started with Crops
Welcome to the Crops section of your new Farmbrite account! We want you to have a basic understanding of what your Farmbrite Crop Management software is capable of before you start setting it up, so let's take a high level look though some of the features you have access to. This may take a little time to set up, but we've built in intuitive processes and handy guides to walk you through each step along the way. You will be planting your crops and tracking their care in no time - with a more structured plan, and hopefully increased harvests!
The first step towards that is to find the section for Crops on the left hand navigation menu. Click to open it and display the five main sections. Each section will have it's own menus and options that we will expand on further in this guide, but here's a quick overview of how you'll use them.
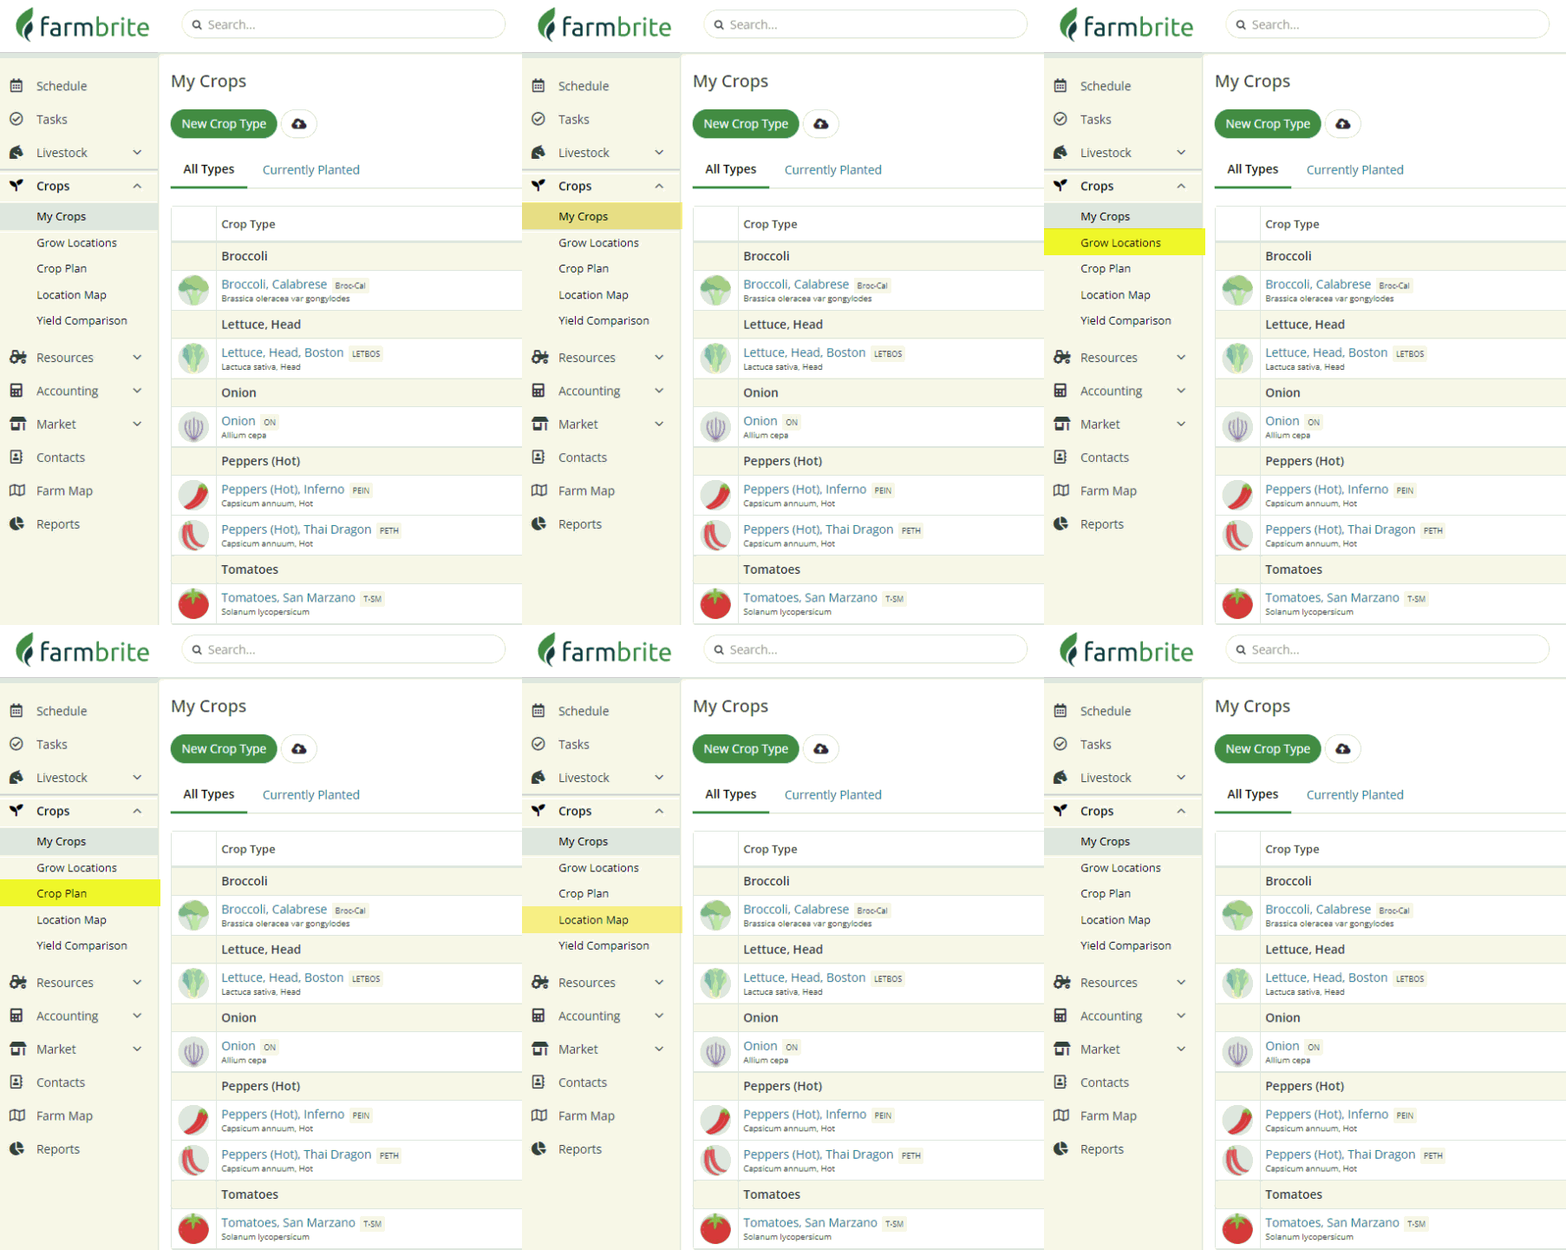
My Crops - You define the types of crops you'll be growing here. Adding your types of crops let's you keep track of the planting and harvest history for the different things you grow.
Grow Locations - You need somewhere to plant those crops, right? Here you'll create your fields, beds, greenhouse, and even cover crops for your livestock to graze. You can keep track of what's planted in each location, and track soil samples, nutrient feeding, and other important data.
Crops Plan - This is where the big picture comes together. Once you have crop types defined and planted in grow locations, Farmbrite will use the crop data to create a chart for anticipated harvest dates for each grow location. This helps you stay on top of each field, harvesting at the optimal time and getting your next successive planting in the ground.
Location Map - Having an aerial view of your farm property can help you better visualize your crops and plantings. In this section you can outline your grow locations on a satellite map, tracing your fields and calculating your acreage.
Yield Comparison - Part of the magic of Farmbrite is having all of your crop data stored in a single location. The Yield Comparison feature aggregates your harvest data over the year to provide insights on which varieties of your crops yielded the most, and which grow locations were most productive. You can select to view it weekly., monthly, or yearly.
Now that you have a foundation for what each section does, let's dive into each one into much more detail. Note that you'll find many links to articles within the subsections below. We encourage you to read and digest this entire guide first to help you understand the overall concepts, and then dive into the individual articles for the specific features and actions. Think of this article as the blueprint for the house you are building; it's critical to understand the structural layout before you start building the upstairs bedrooms.
My Crops
This section of your Farmbrite system is where you'll define what crops you grow, track your plantings, and record your harvests.
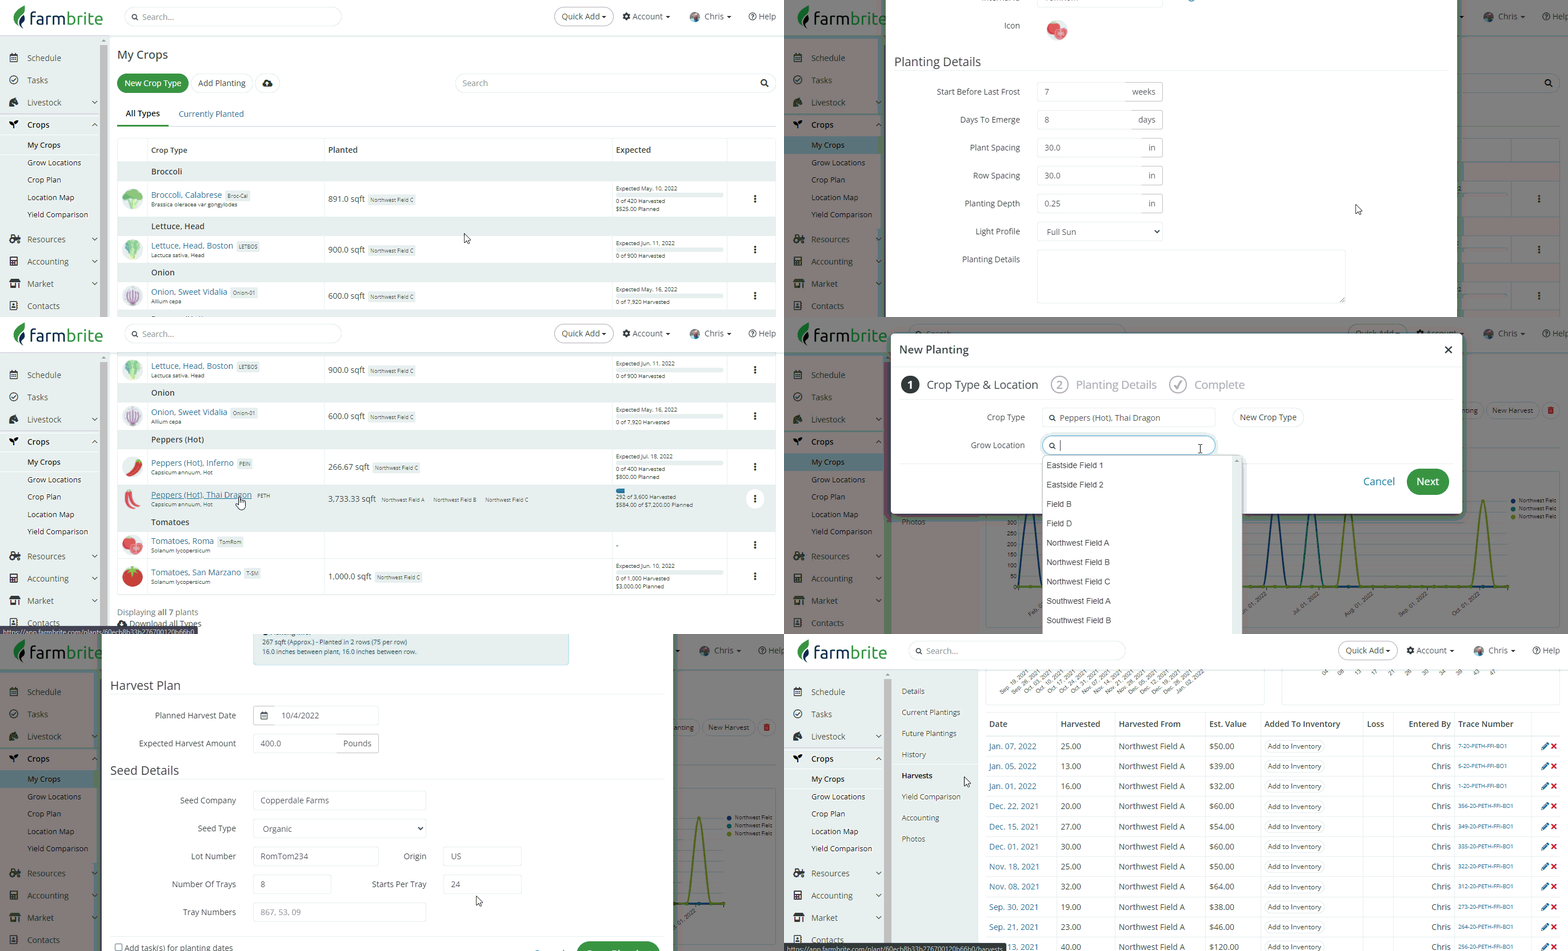
- You first add the types of crops you'll be growing by choosing from our preloaded list, or creating your own unique varieties and strains. This includes the ability to define key plant characteristics like row spacing, plant spacing, planting depth, light profile, and harvest attributes. Bonus: Our preloaded crops have this information associated with them automatically! You can also create custom fields to track other characteristics of your crops that might be unique to your operation.
- Having this data in Farmbrite helps you create a plan for your growing season - when you're planting, when you can expect to harvest, and how much you might expect to yield. This allows for easier successive plantings, ensuring you utilize your grow locations to their full potential.
- After outlining your plan, you'll put it into action by creating Plantings. You can track current and future plantings, as well as your planting history. Easy to read charts show you when you should put your plants in the ground, and when you can expect to harvest them.
- Fast forward a few months, and you'll be harvesting your crops and recording your yields. Keeping track of the amount you harvest from different fields and beds helps you chart your progress over time to see what's working right, and what improvements you might make.
Did you notice how we selected Northwest Field B and Bed 02 to plant our Thai Dragon Peppers in the video above? Let's move on to the next section to learn how we added that field and how to work with it in Farmbrite.
Grow Locations
The tracking of your crops outlined above relies on you defining the different locations around your property that you'll plant them. These locations can be anywhere that you are growing plants and want to keep track of the productivity of that area. For example, a grow location can be created as a traditional 40 acre field of row crops, an orchard of trees or berries, a market garden plot, a raised bed, a greenhouse, or even a grazing area for your livestock.
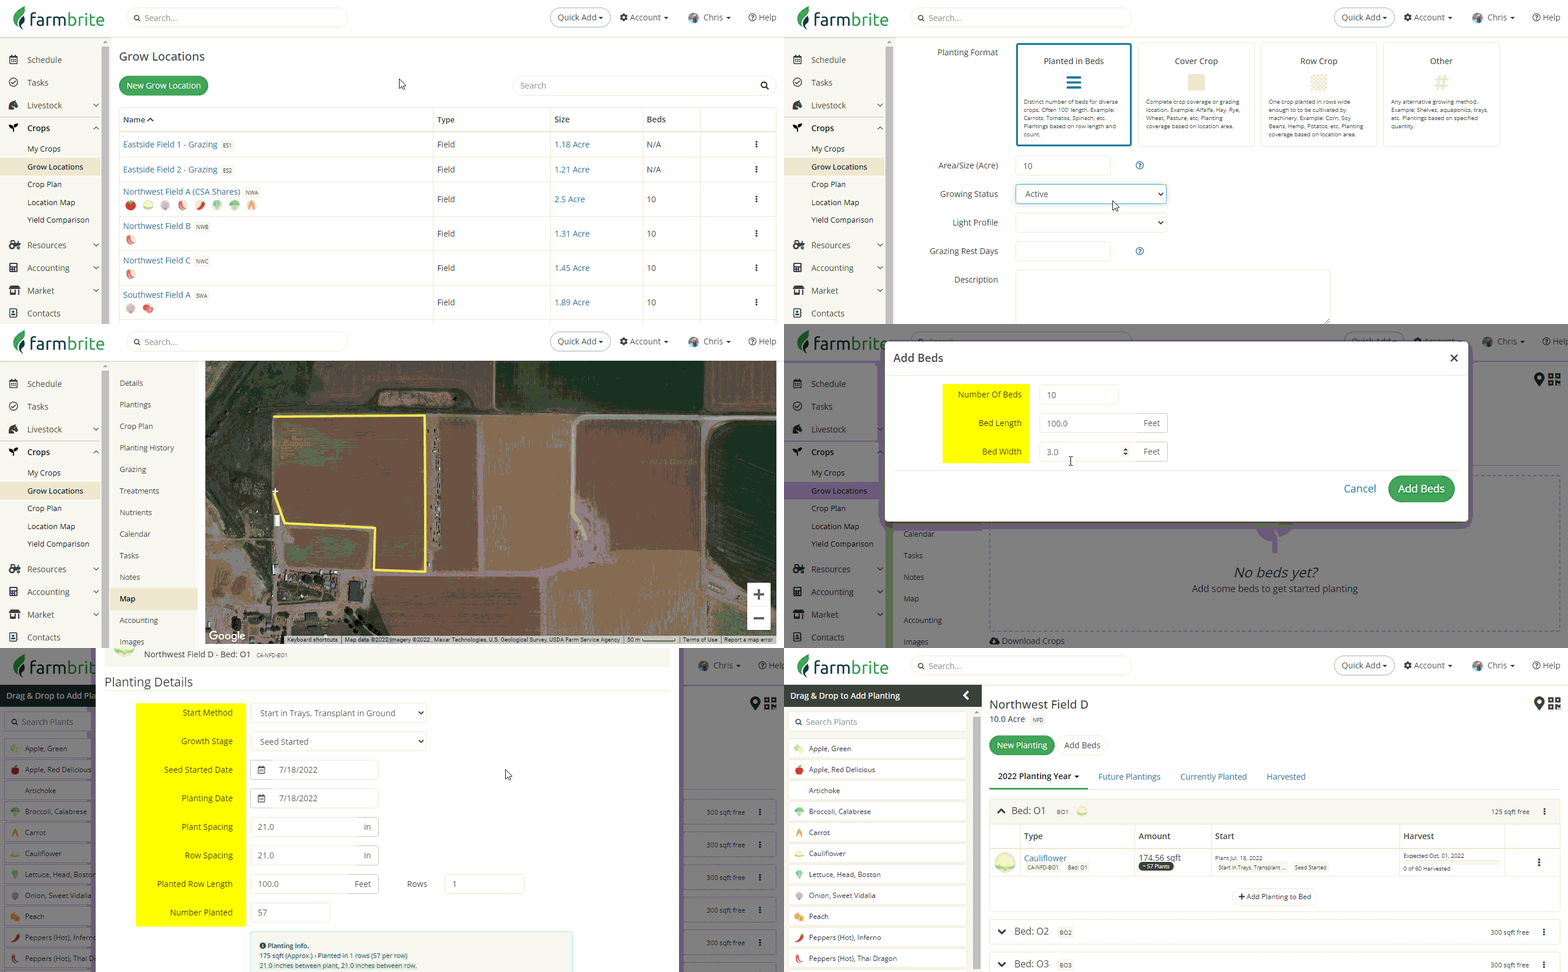
We've made this as simple as possible by providing you with a step by step wizard that walks you through the process. When you choose to Add a Grow Location, you'll see three steps outlined.
- Step 1- First, you'll define the characteristics of the grow location - is it a field with beds, or planted in rows? Or maybe a greenhouse, grow room, or even a grazing field.
- Step 2 - Next, you'll add the grow location to your farm map. This gives you a visual representation of the area over satellite images, and calculates the acreage of the planting area for you automatically. This step is optional.
- Step 3 - And now it's time to add you crops to this grow location by creating a planting. We gave you a peek at this process in the My Crops section above; now that you have your location defined and mapped you can get your plants in the ground! Alternatively, if the field you created is planted as a cover crop and used for grazing, you could then move your animals to this location.
Just like the fields on your farm, your work does not end with getting your plants in the ground! After creating your grow location and adding a planting, you'll have many options to track the work associated with it throughout the season.
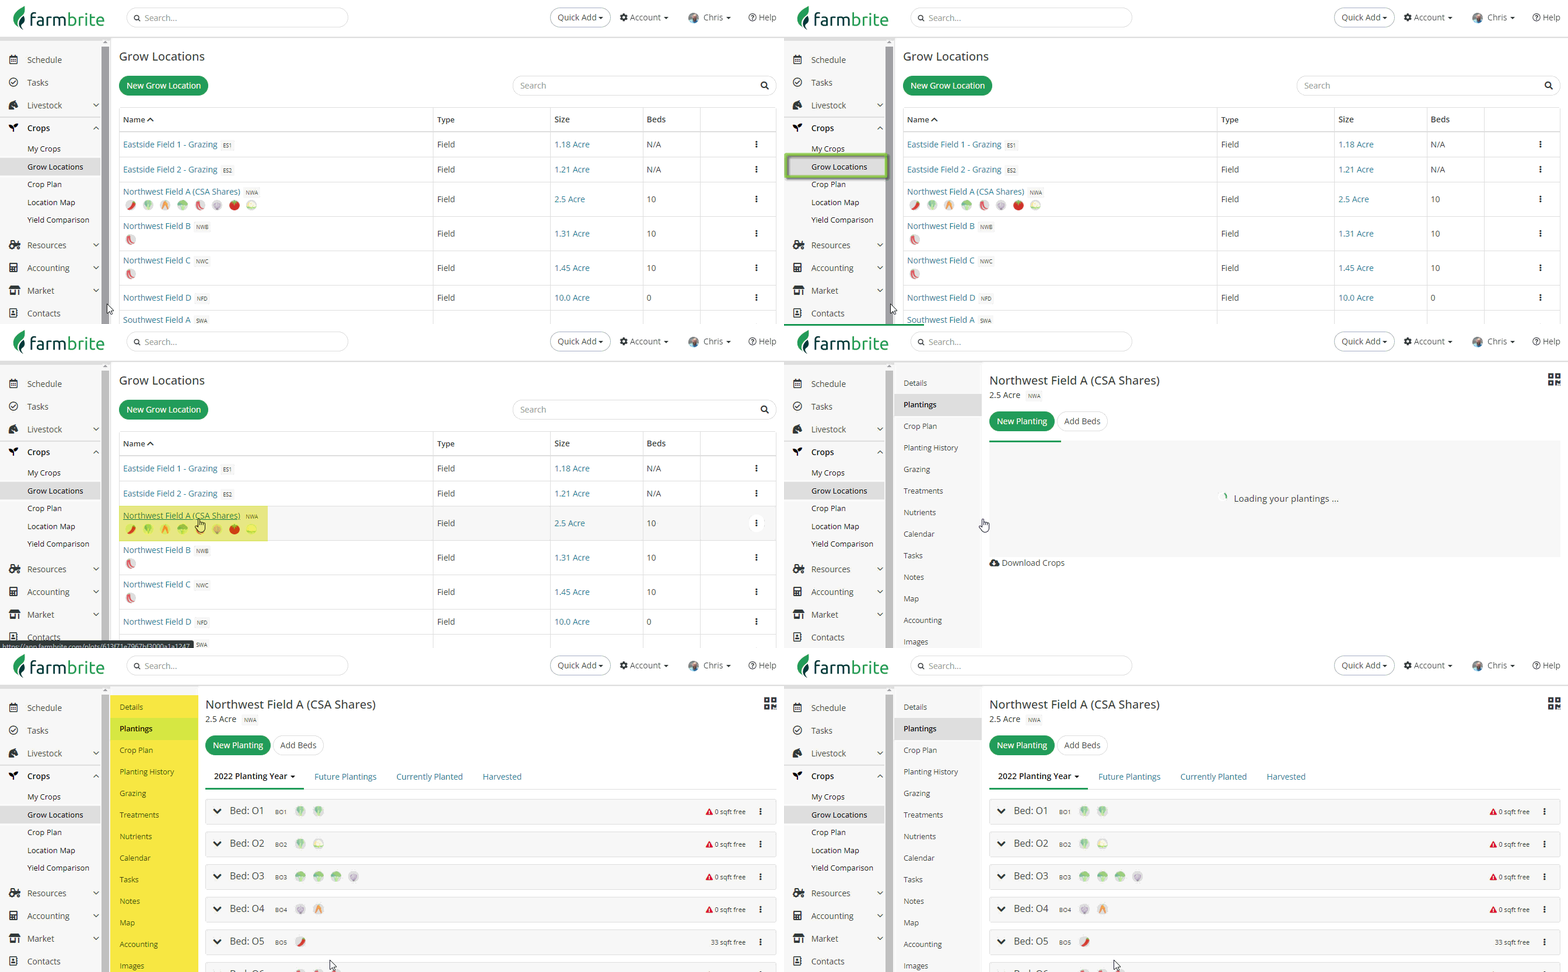
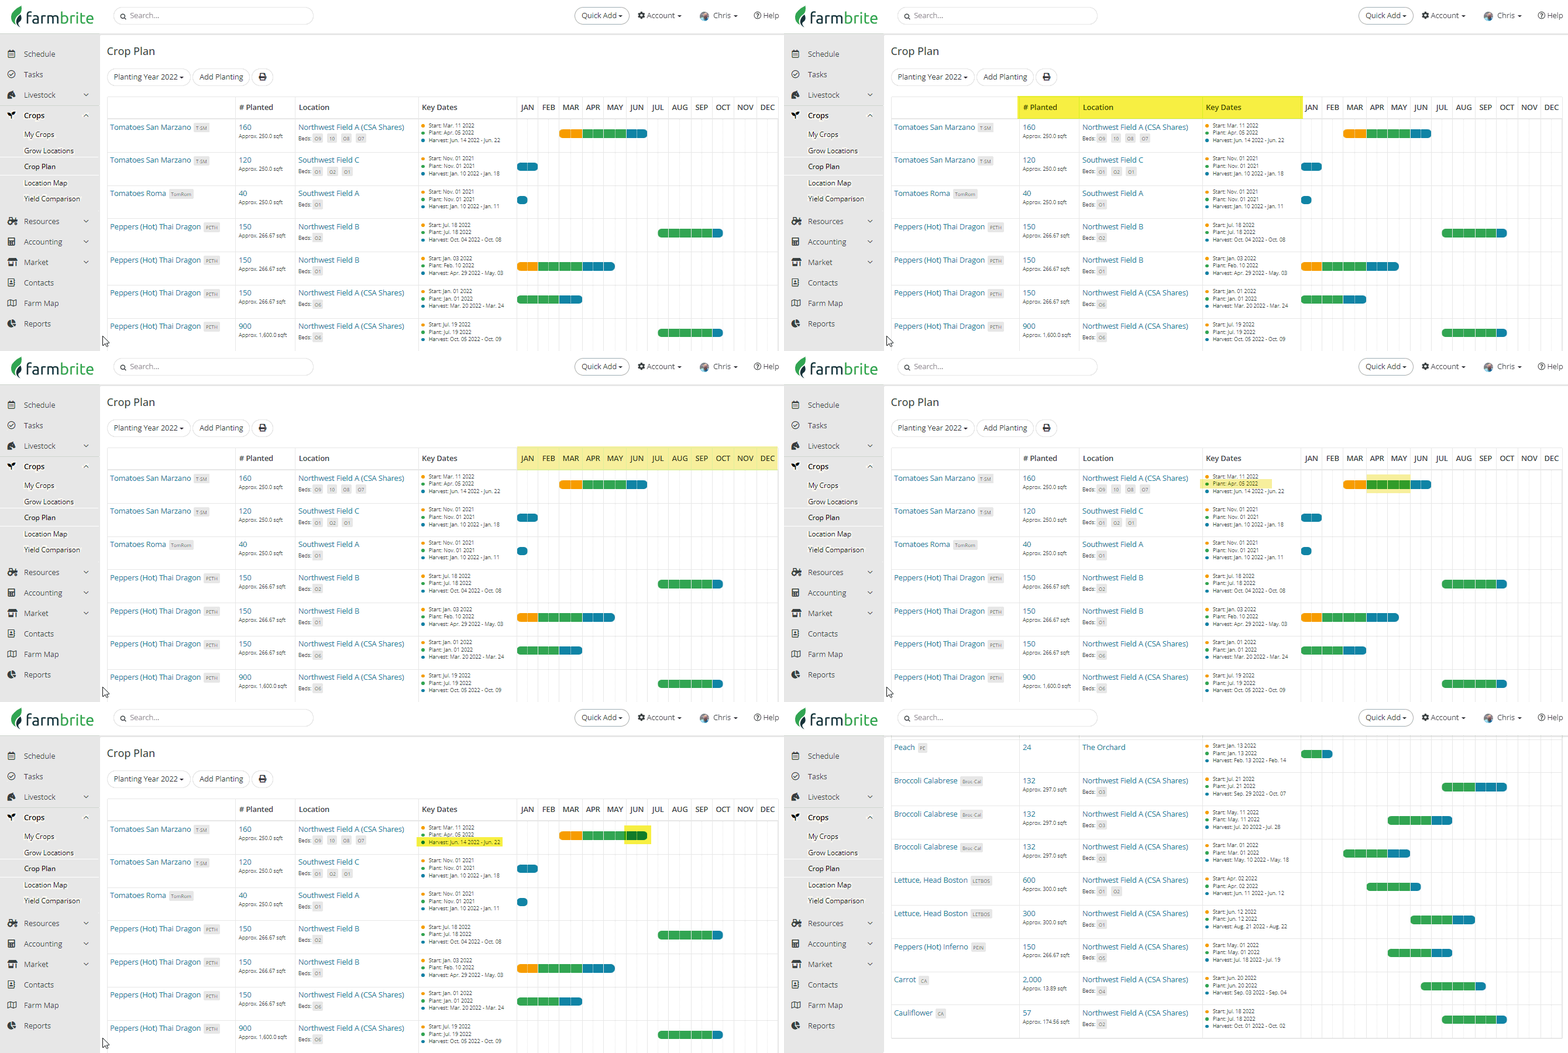
You'll land on the Plantings menu, showing you all the current and future crops that you have associated to this grow location in this current growing season. You'll also find your Crop Plan for this grow location. This easy to read chart displays each planting and harvest over the calendar year, giving you an overview of what crops are planted where, throughout the year, and when you can expect to realize a yield.
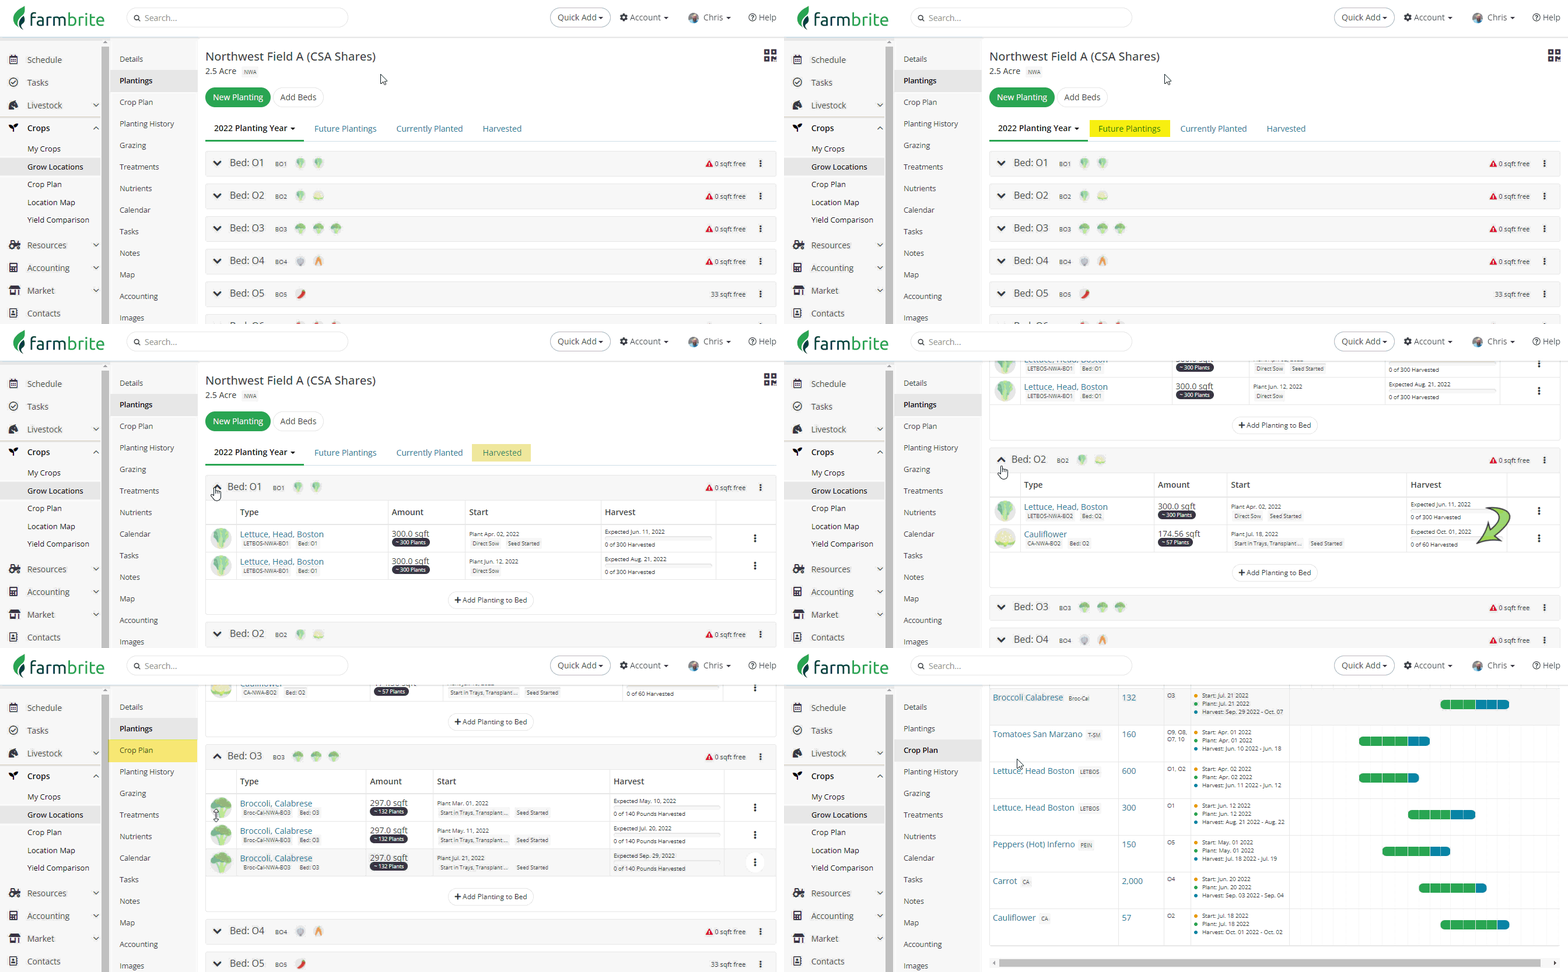
Of course you need to take care of your crops to get those bountiful harvests you're looking for, so you'll be able to track your nutrients and treatments applied to your grow locations throughout the season. You can record when you apply fertilizers and then track their efficacy by taking soil samples and watching your nutrient and PH measurements change over time in easy to read charts. You can also document the treatments you add to your grow locations - insecticides, herbicides, fungus and mold treatments, and more.
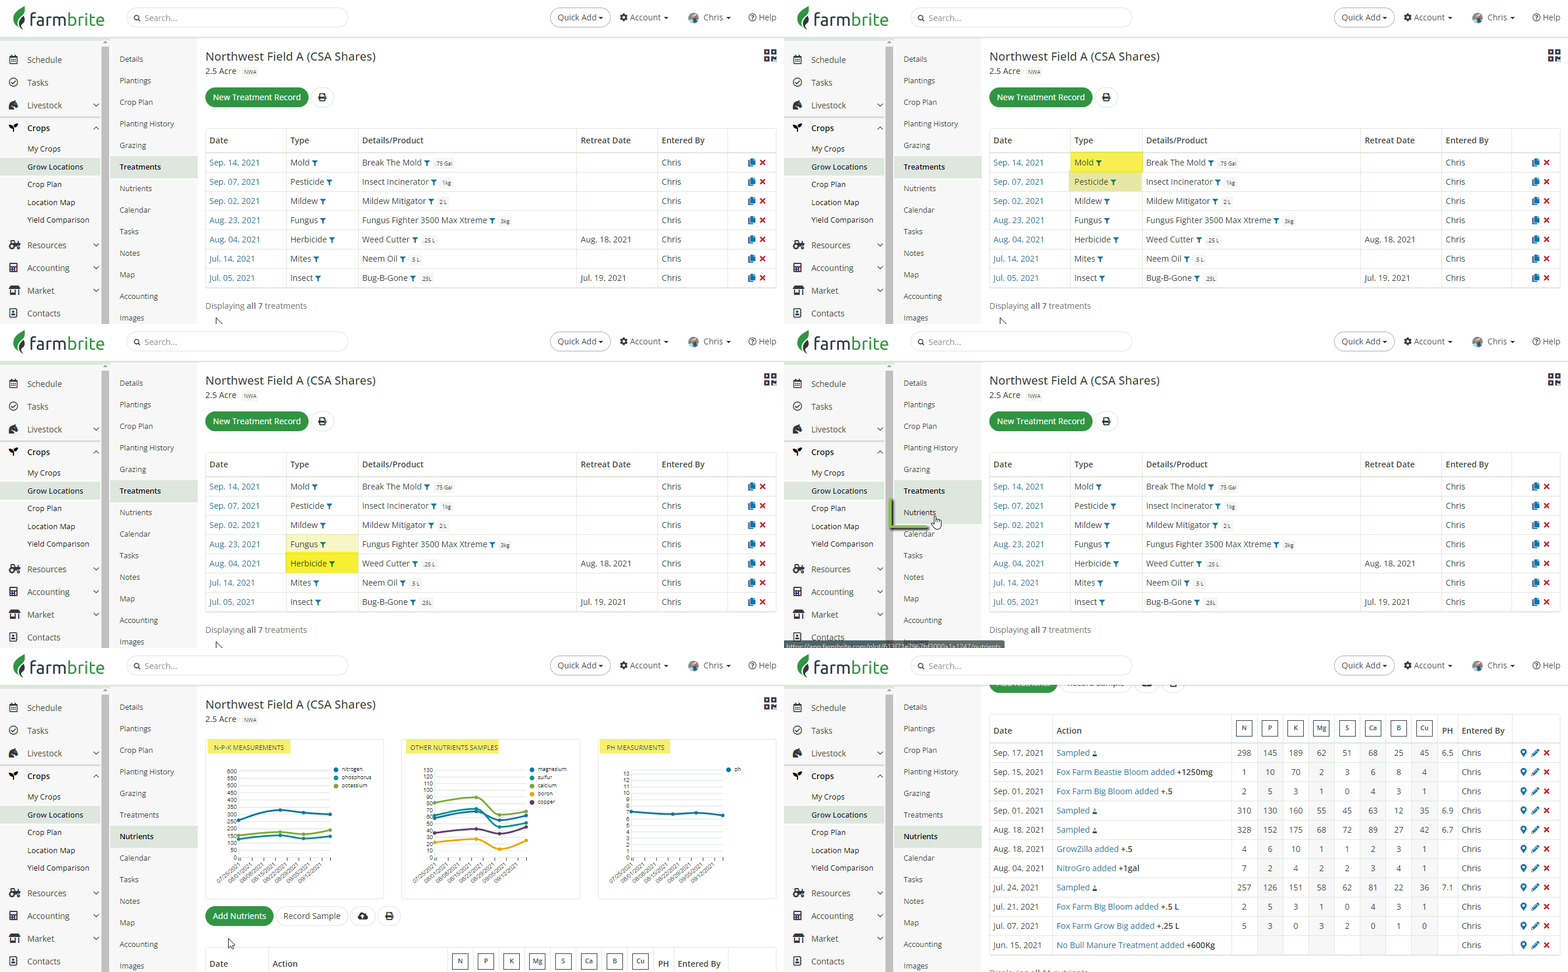
We know that putting plants in the ground and feeding them isn't the extent of your business - your farm has many interconnected responsibilities that are critical to your success. We also know that you'll probably need reminders to make sure those responsibilities are taken care of, and might want to assign some of those chores to your farmhands. Farmbrite can help you with this in a few ways.
- You'll have the ability to create tasks associated with your grow locations - think of these as a to-do list for your field, ensuring you start your crops, plant them, take care of them, and harvest them at just the right time. The tasks can be assigned to your Farmbrite users; they can track their progress and record their hours worked on each.
- Beyond the day to day chores, you can track special events with your Farmbrite Schedule. This built-in calendar is a great place to track upcoming farmer's markets, your CSA deliveries, or visits from consultants.
- You can also record notes for your grow locations. You might use this feature to jot down tips for next season about what worked best in this grow location, or comment about weather conditions and unique situations that affected your crops.
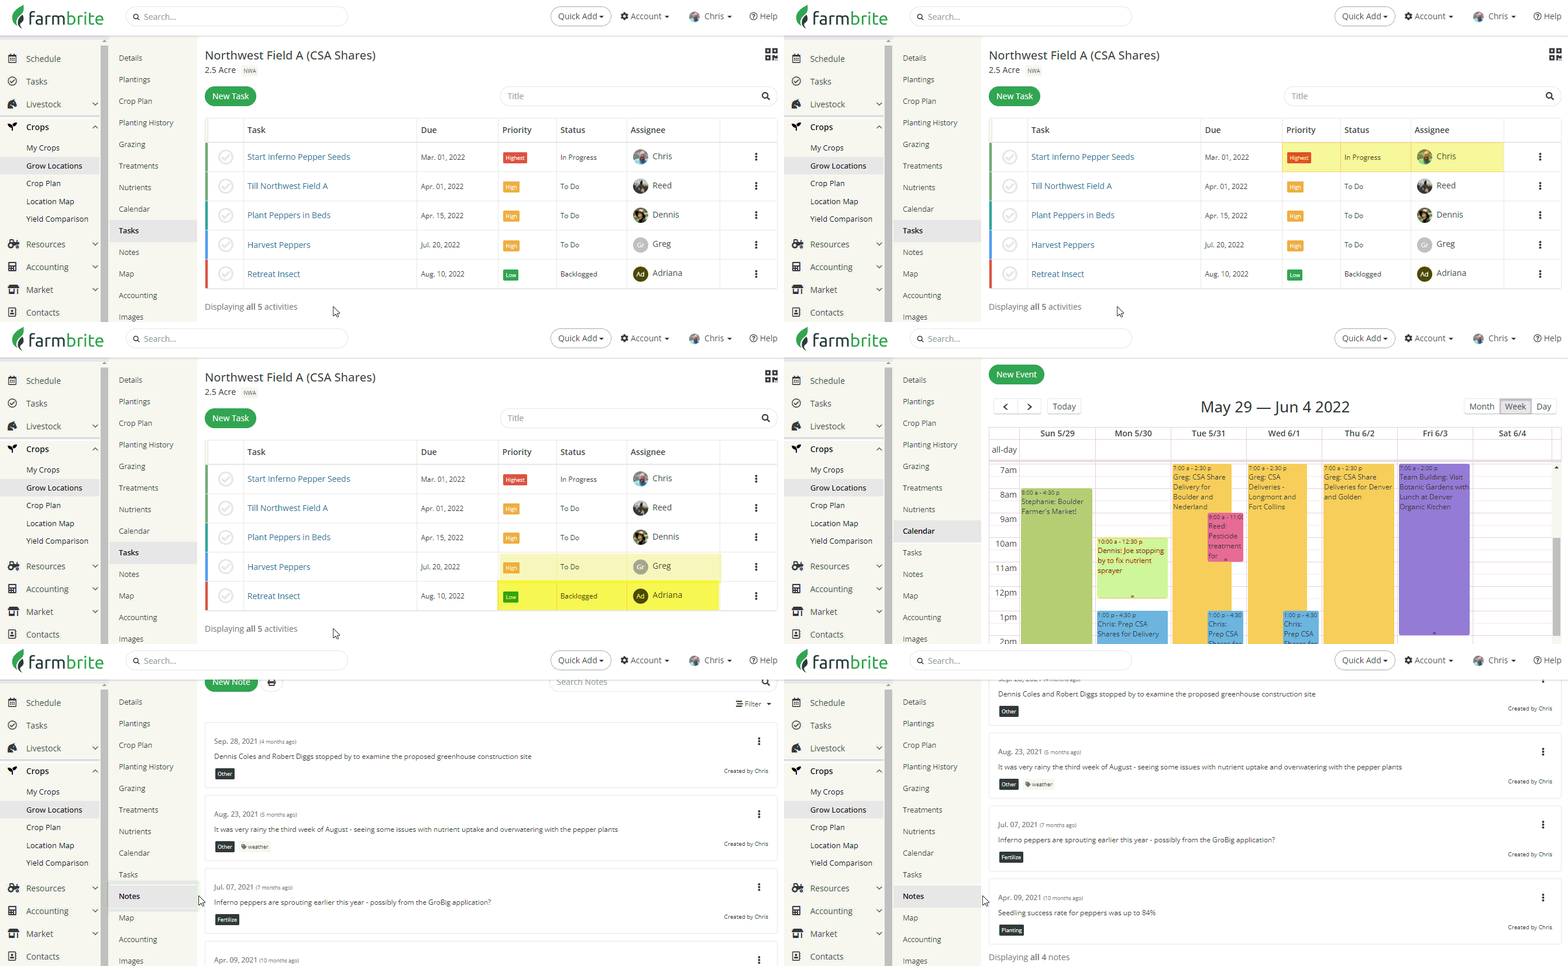
You can also upload images and files associated with your grow location. Maybe you want digital scans of the soil sample results we talked about, or perhaps you'd like to store other field related documents - permits, certifications, land surveys, or whatever important paperwork you want in one easy to access library. Cataloguing images of your fields and crops might be helpful too. The written notes you take are certainly useful, but having images of your crop growth throughout the season might be even more beneficial. Imagine referencing photos of last years crops during your next season and comparing growth during different stages, or having photos of the insect infestation that ruined your tomatoes to reference for the early warning signs and prevent it next season.
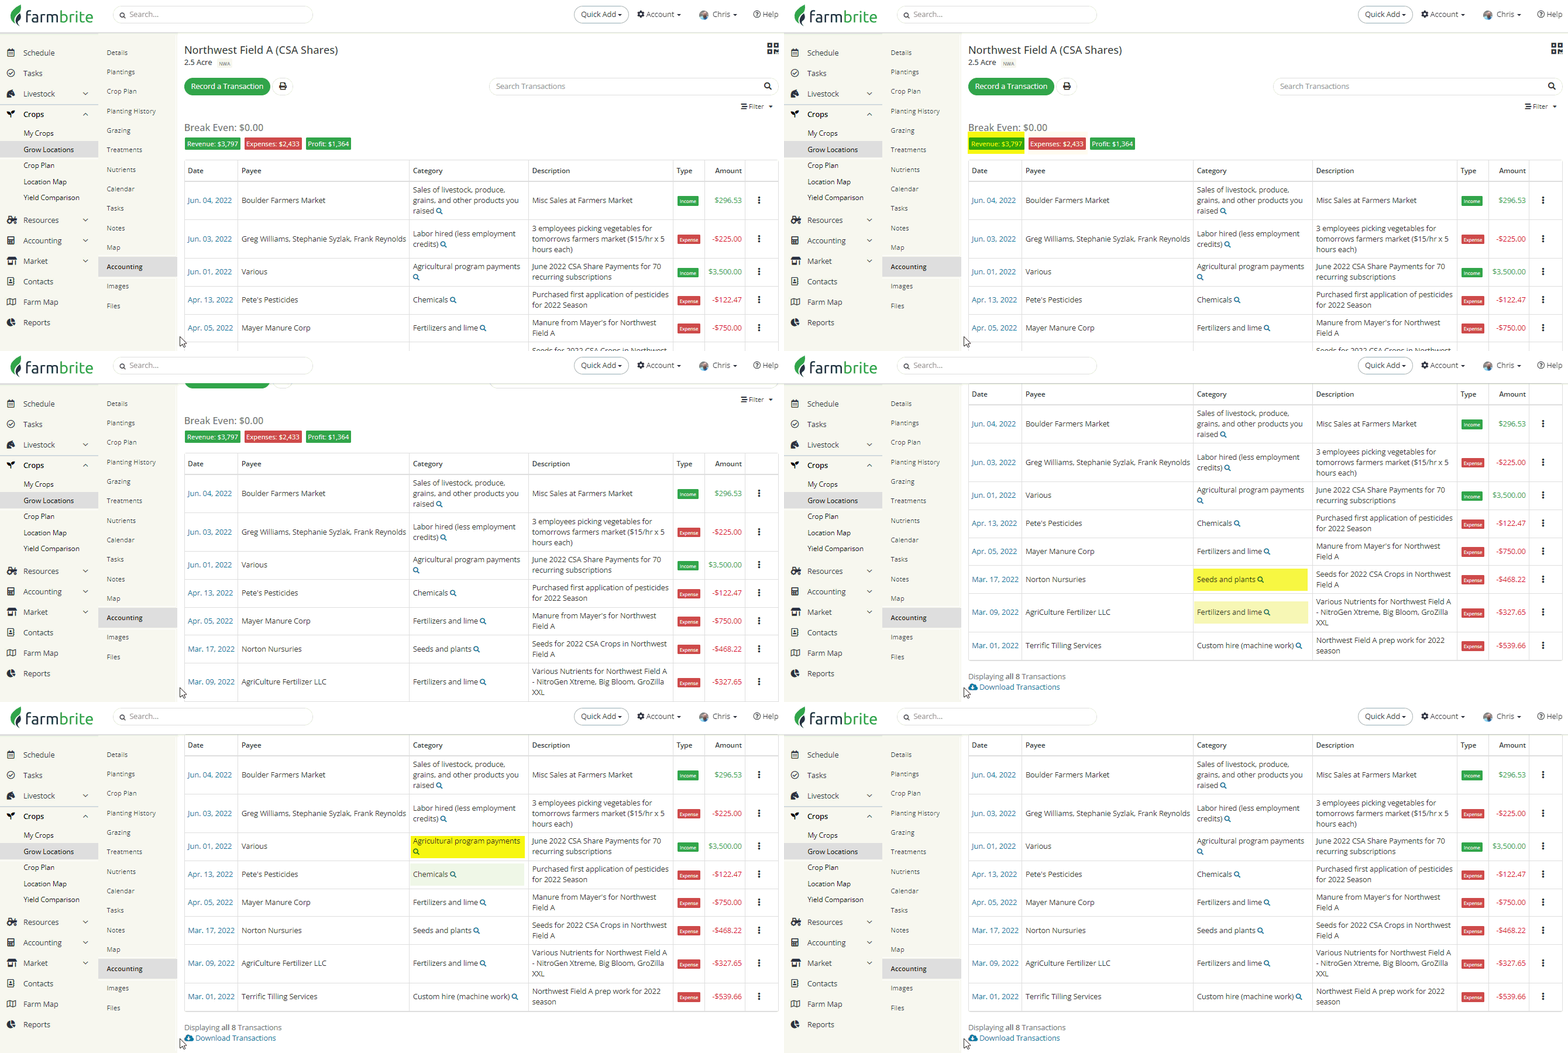
It's easy to track your expenses and income for a grow location by recording transactions under the Accounting section. Farmbrite comes preloaded with default categories for these transactions, and the examples you see in the image below are just a few of the ways you can segment your accounting records. You can keep track of what you bought, when you bought it, who you bought it from, and how much it cost. You might even track labor costs as well. On the other side of the statement, when you sell your produce you're able to track that income, with your profit automatically calculated. These transactions also transfer to your Farmbrite Profit and Loss Statement, which correlates to your IRS Schedule F Form 1040 and simplifies your tax filings.
Crop Plan
We briefly highlighted the Crop Plan feature for a single grow location in the section above. You'll recall seeing the chart of this year's plantings for that grow location with expected harvest dates. Beyond the plan for that single location, you'll find your entire farm Crop Plan within the Crops menu. This complete overview shows all plantings of all your crop types, over all of your fields and beds; it brings together of all the work you did in the above two sections, showing a single easy-to-read plan for your entire planting year. You can learn more about it in this article.
Location Map
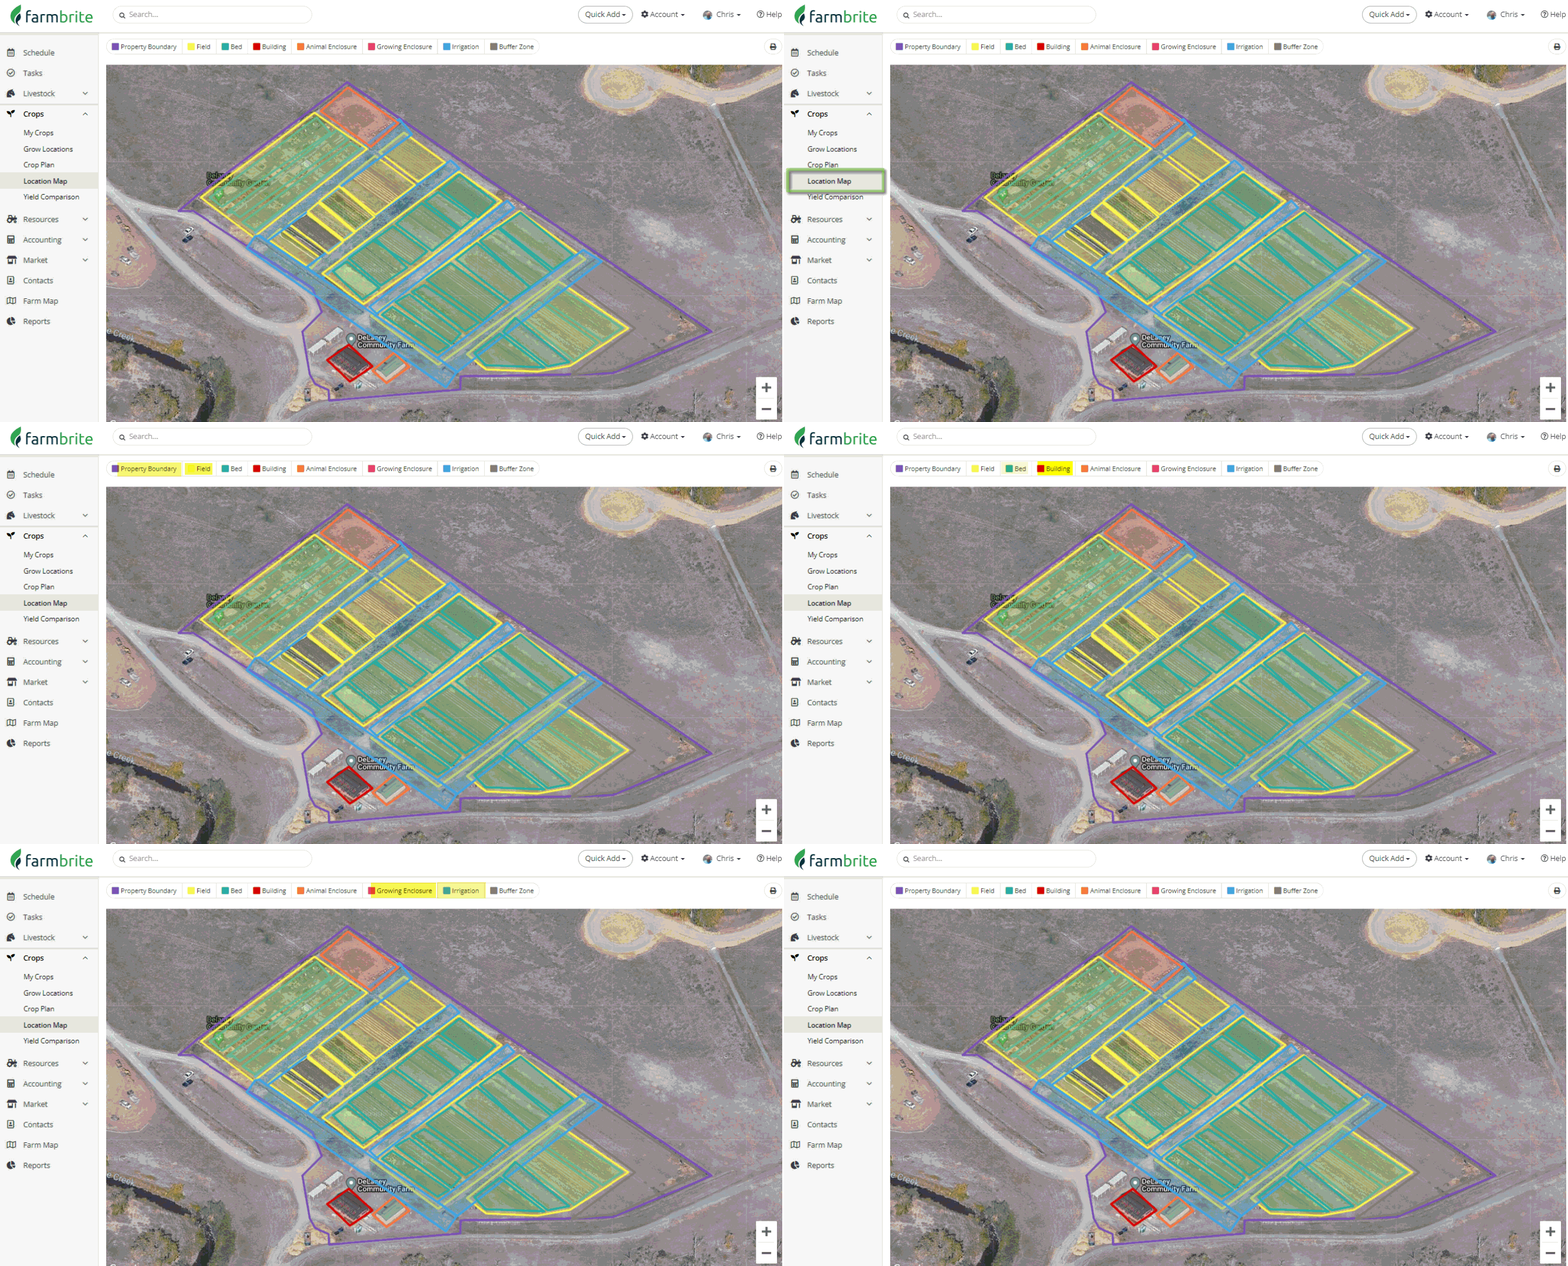
Like the Crop Plan, we've also seen the Location Map feature for a single grow location earlier in this guide. When you create your grow location, you are asked to map it's location on your property. In the same way that the Crop Plan can be seen for all locations at once, you can click Location Map in the Crops menu to see a satellite view of your property with all grow locations displayed. Many Farmbrite users enjoy this feature, as it provides an opportunity to look at your property from a different vantage point, sparking new ideas for field and crop layout which may lead to improved efficiencies in land use. Beyond giving you a bird's eye view, mapping your farm will also enable automatic calculations of estimated plant counts, which then factors into your estimated harvest revenue.
Yield Comparison
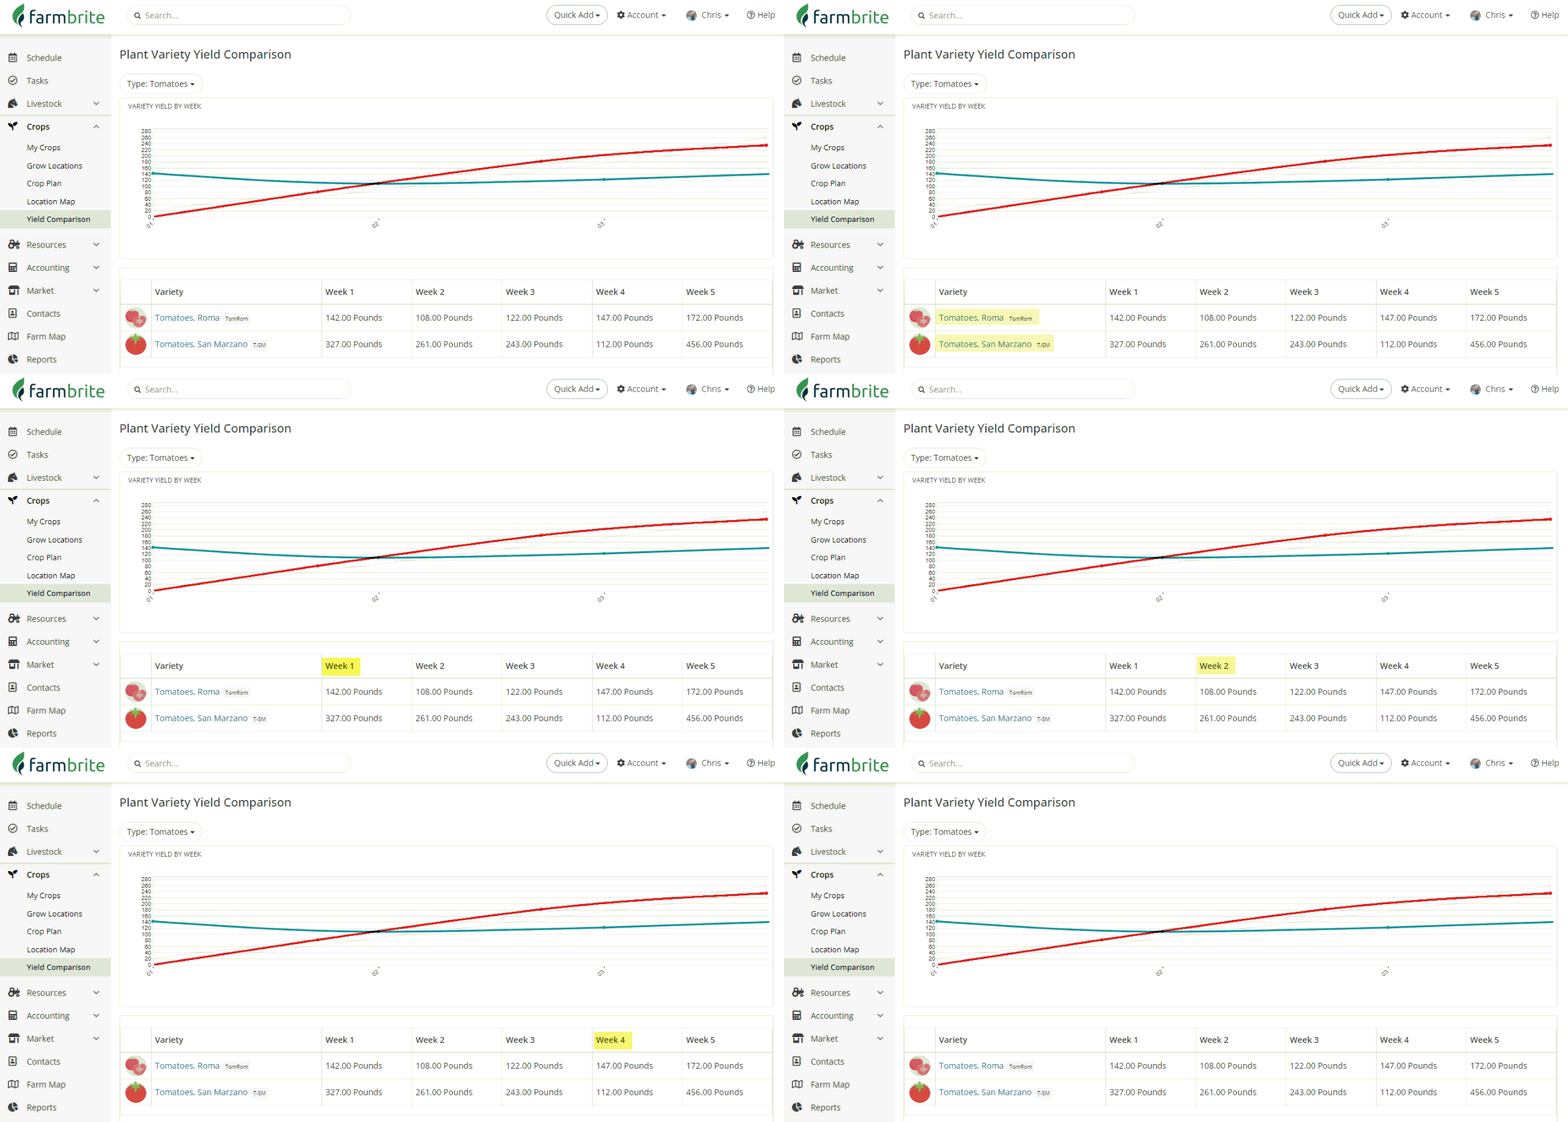
We know that part of your business is experimentation. You try different methods and locations to see what works the best, and then implement the solutions that lead to the healthiest crops and highest yields. Maybe you used different fertilizer on the peppers in Northwest Field A, or perhaps you planted the tomatoes with additional row spacing in Southeast Field B. Light conditions, time of year, nutrient density, and watering frequency all play a part in plant health and harvest yield. Beyond that, different plant varieties may yield better than others on your property based on your local conditions and climate, and might be better suited to be planted at different times based on those unique conditions. Being able to record and report on these variables can help you make data driven decisions for you next planting. Farmbrite's Yield Comparison will help you compare the harvest yield from different varities of your crops by providing easy to read charts that span your entire growing season. You'll be able to tell what varieties yielded the most, and when the optimal time to plant them next year might be. You'll be able to analyze the data you store in Farmbrite, and then make the right decisions going forward, streamlining your business operations and improving efficiency.
Crop Reports
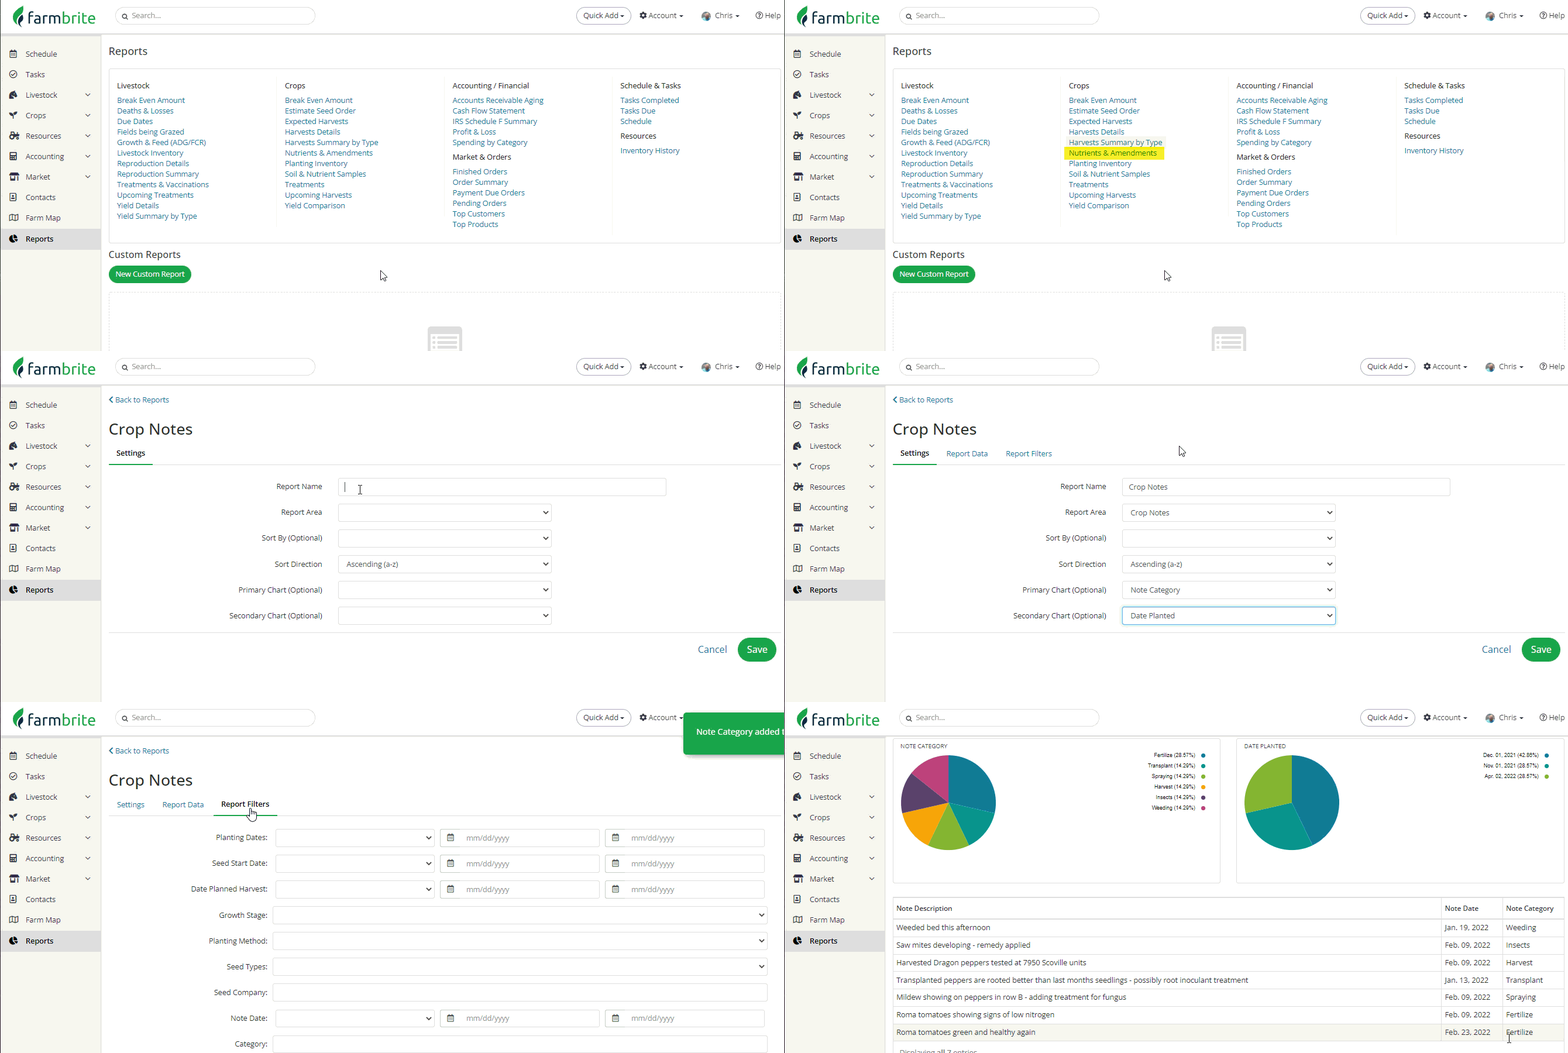
Beyond the Yield comparison, you'll be able to run various other reports that compile additional information about your crops. You'll navigate away from the Crops menu for this though - find the Reports section on the left, and then look through the block of Crops reports on the main reporting page. Some are financial related like your Break Even Amount, while others detail harvest data like Expected Harvests and Harvests Details. You'll also find reports for your nutrient applications, treatments, and soil samples. If you don't find what you're looking for in the standard report, you'll also have the opportunity to create custom reports. These allow for in depth reporting on what's important to you; you choose the data, how it's sorted and filtered, and can even add relevant charts.
Summary
Now that you have read through this entire guide, it's time to dive in and get your hands dirty - go back up to the top of the guide and start building your system! Be sure to click through all the embedded links to learn many more details and intricacies of the features. Don't forget you can also reach out to us when you need help - we're glad to lend a hand and point you in the right direction.