The Accounting Dashboard is the first stop in your Farmbrite Accounting journey. You can view and update all of your previously entered transactions here, and create new ones to record income and expenses. These transactions are also searchable, filterable, and sortable, giving you the opportunity to find exactly the records you're looking for. Wondering what you paid to your old feed supplier compared to your new one, or how much your total harvesting expenses were last year? Just search by keyword or filter by category and easily find your individual transactions and totals. The Dashboard also presents a handy graph that displays a comparison of income and expenses, and a chart to break down your expenses by category.
Working with Transactions
If you don't have any transactions entered in your Farmbrite Accounting system yet, you'll need to add them before you can see data on this page. You can follow the instructions in this help article to get started. Once you have transactions, you'll see them displayed in the grid on the lower portion of your Dashboard.
You can work with these transactions in four ways. Watch this quick video below for examples, and then read more about each feature below.
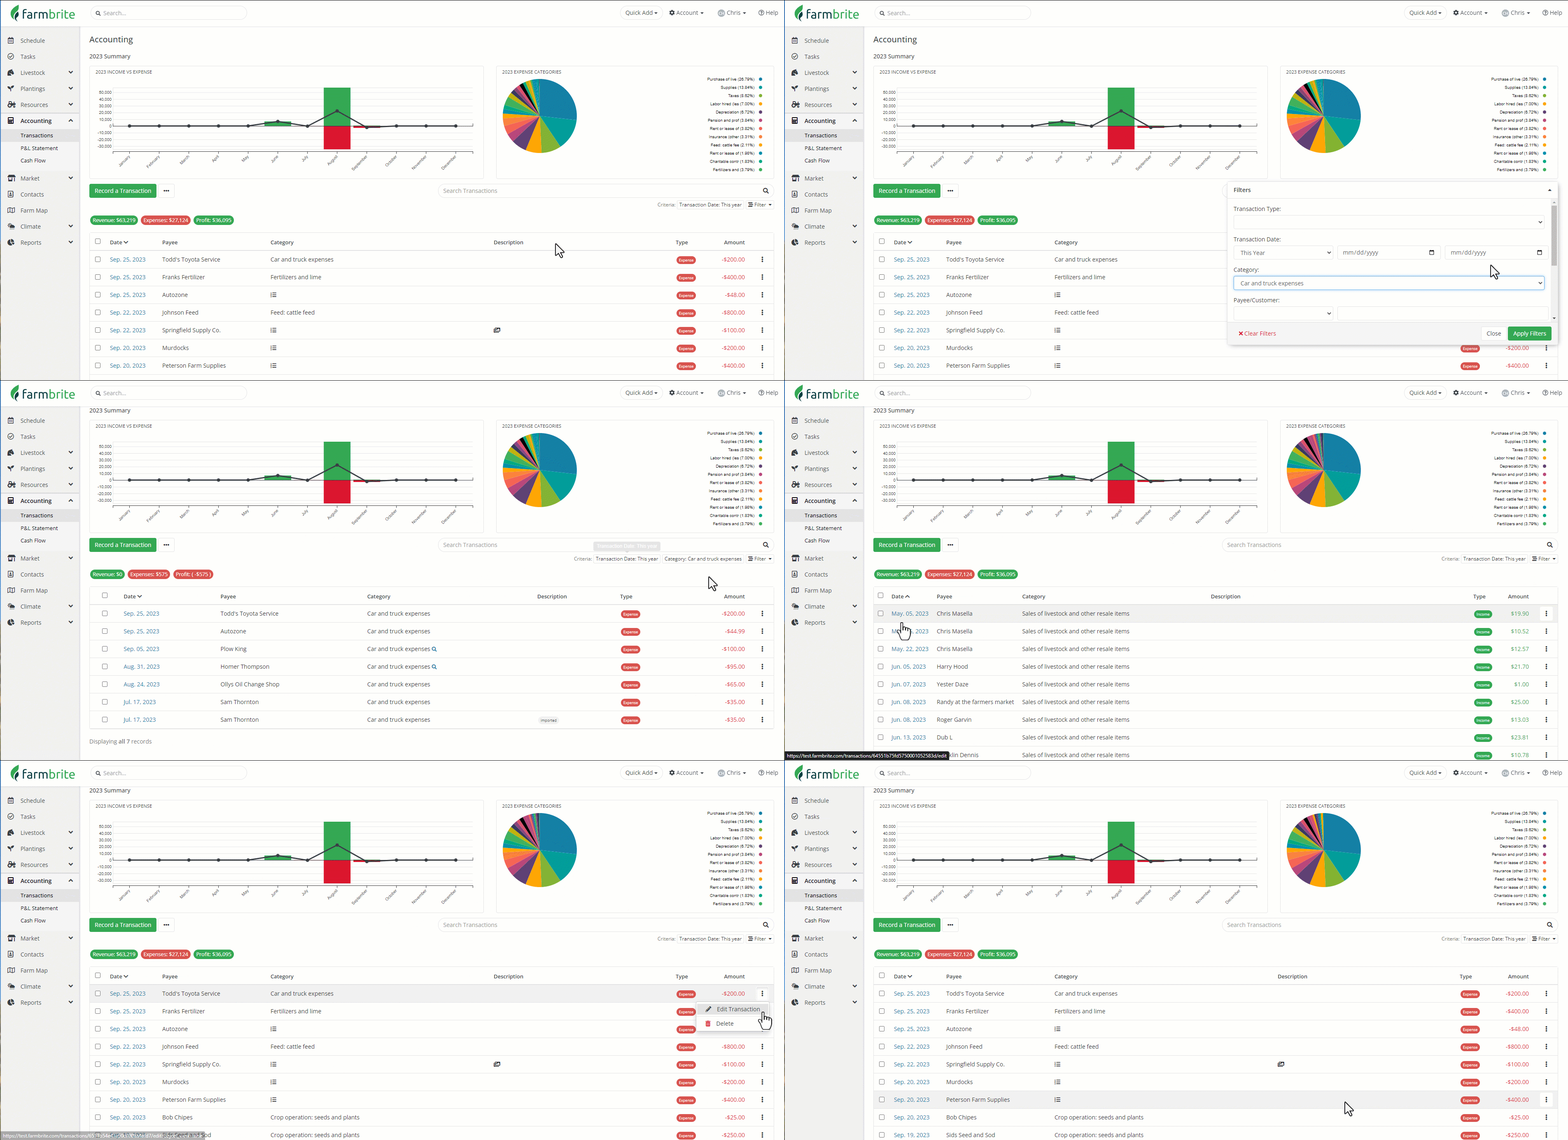
- Filter - If you're looking to find multiple transactions that meet your criteria, you can filter rather than search. Click the filter button below the search bar, and you will see options expand to refine your results. You can use a combination of them to get more granular. For example, you could filter by keyword, type, and date to find just CSA share income for a specific month.
- Type - Are you looking for income or expense transactions?
- Payee/Customer - Who did you pay, or who paid you?
- Keywords - Show transactions that you've tagged with specific keywords or phrases.
- Date - Display transactions that occurred within a specific date range.
- Reporting Year - View transactions that you associated with a specific reporting year.
- Category - Look at transactions associated with a certain accounting category.
- Tax Line - Find transactions that are associated with a specific tax line ( from your Tax Summary report)
- Search - Use the search box on the right to look for keywords, payee/customer, or check number. This is helpful if you are looking for more information about a specific transaction.
- Sort - Click on any of the column headers to sort the grid by the information in the column. For example, you might sort by date to get a chronological list of transactions. Click the date column again to reverse the order and see your newest transactions first. You can do the same with amount, category, or any column you find useful.
- Update - Use the "3 Dots" actions menu on the right of any transaction to make edits. This can also be accomplished by clicking on the transaction row itself. A window will open for you to update and edit existing information about the transaction. You can also delete the transactions from the action menu. Be careful though - deleting a transaction is permanent, and the transactions cannot be restored once deleted.
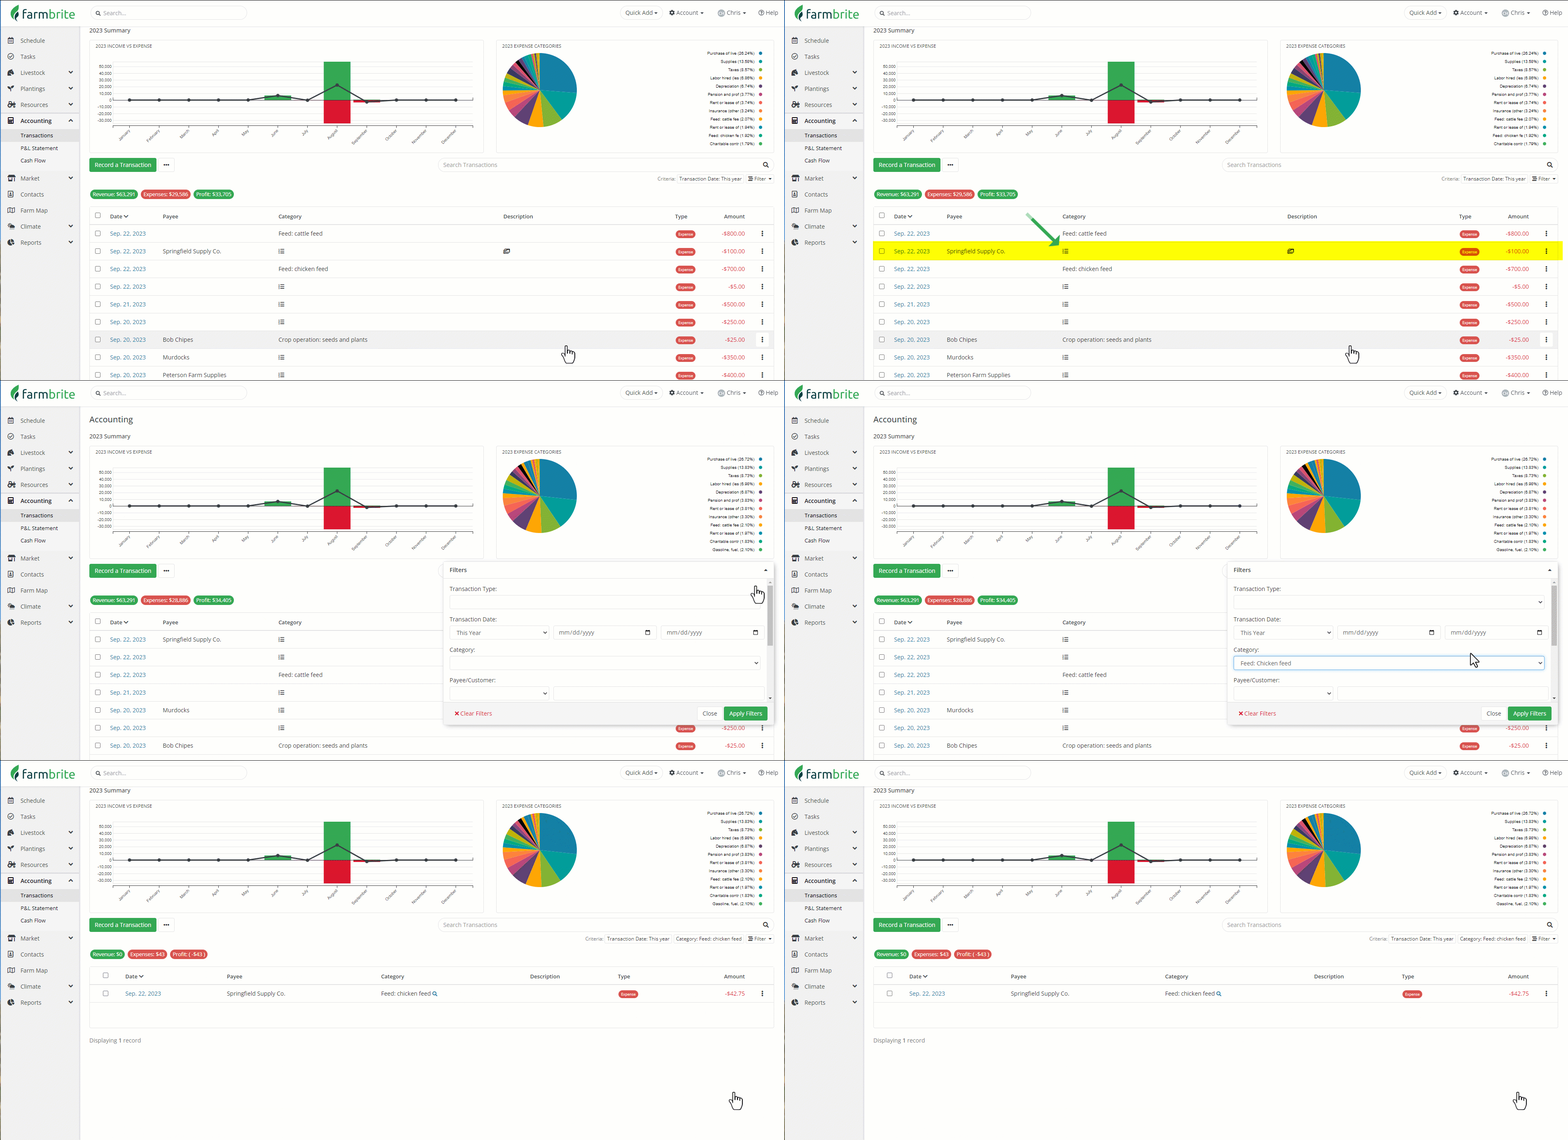
Split Transactions
If you have split a transaction into multiple accounting categories, you'll see a unique icon on the transaction to represent this. When you click into the transaction, the individual transactions that are associated with it are shown, with the correct category and associated record (if applicable). If you filter your list by category like the example below, you'll see the indivdiual split transactions, and the correct totals for each category including the child/split transactions.
Charts and Graphs
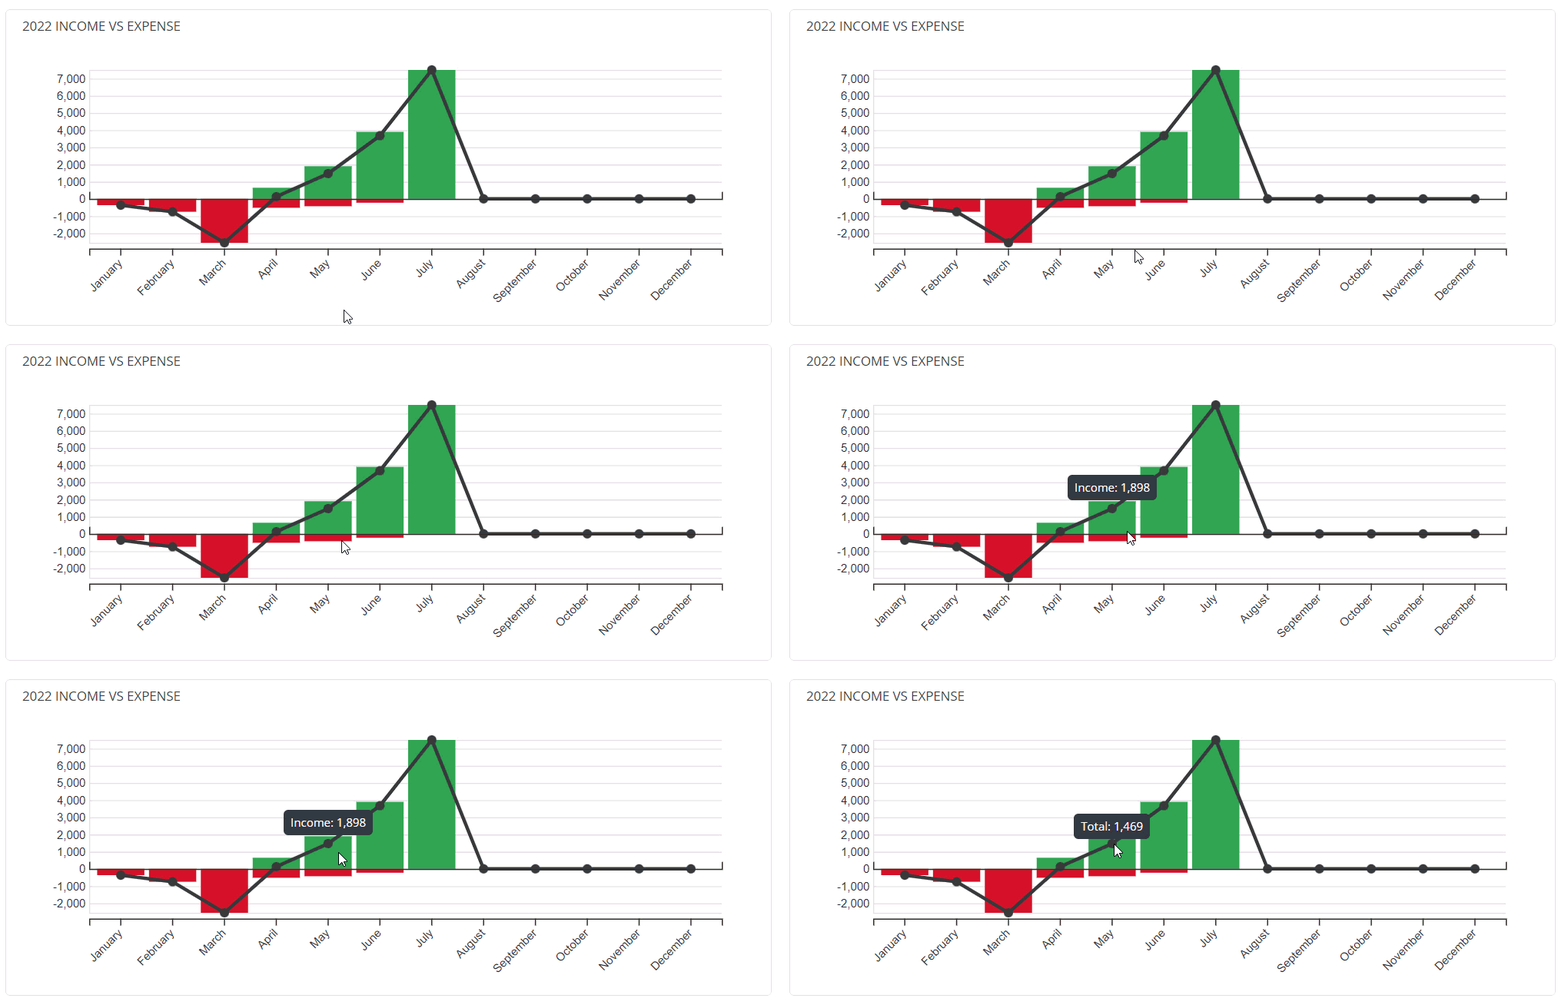
If you prefer a visual representation of your finances, the chart and graph at the top of the page provide an easy to interpret summary of your transactions.
On the left, you'll find an Income Versus Expense Comparison. This bar graph plots each month of this calendar year, showing your total income in green and expenses in red. In the example below, we're investing in our crops during the winter months, but then seeing the return in spring and summer when we start selling CSA shares and open our booth at the farmers market. You can hover over the graph to see the numbers that make up each month's income, expenses, and total.
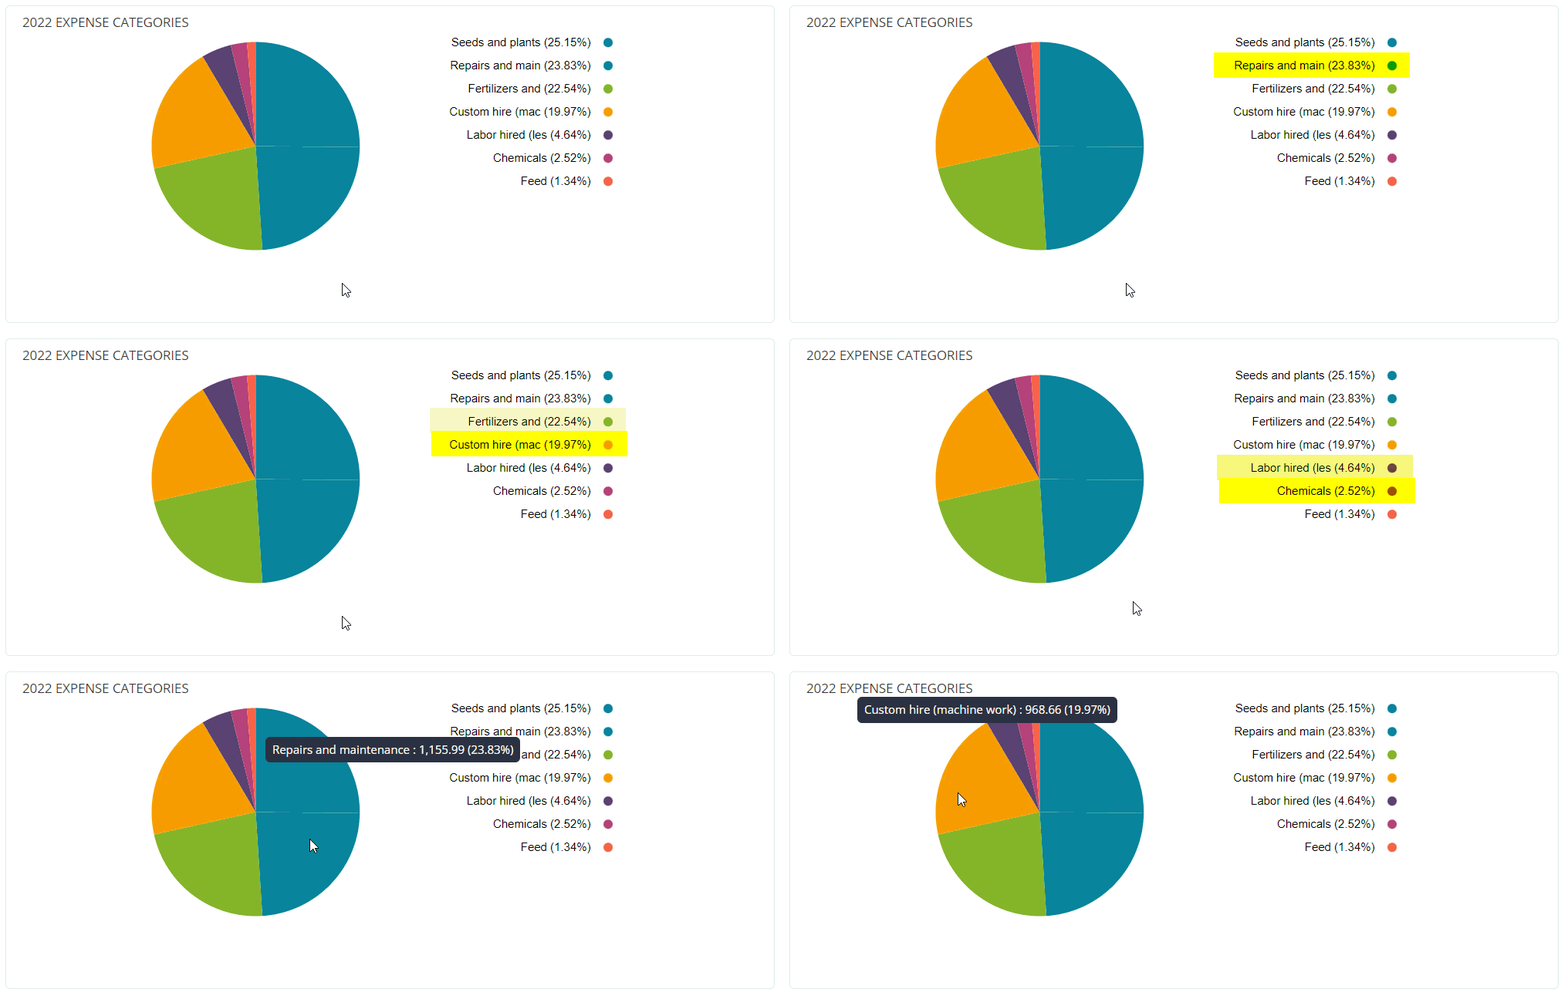
On the right, you'll see a pie chart showing expense categories. This displays the percentage of overall expenses assigned to each category. Hover over each slice to see more information - the category and the total. The right side also displays each category with the percentage as well, with the highest percentage at the top of the list.
Exporting Transactions
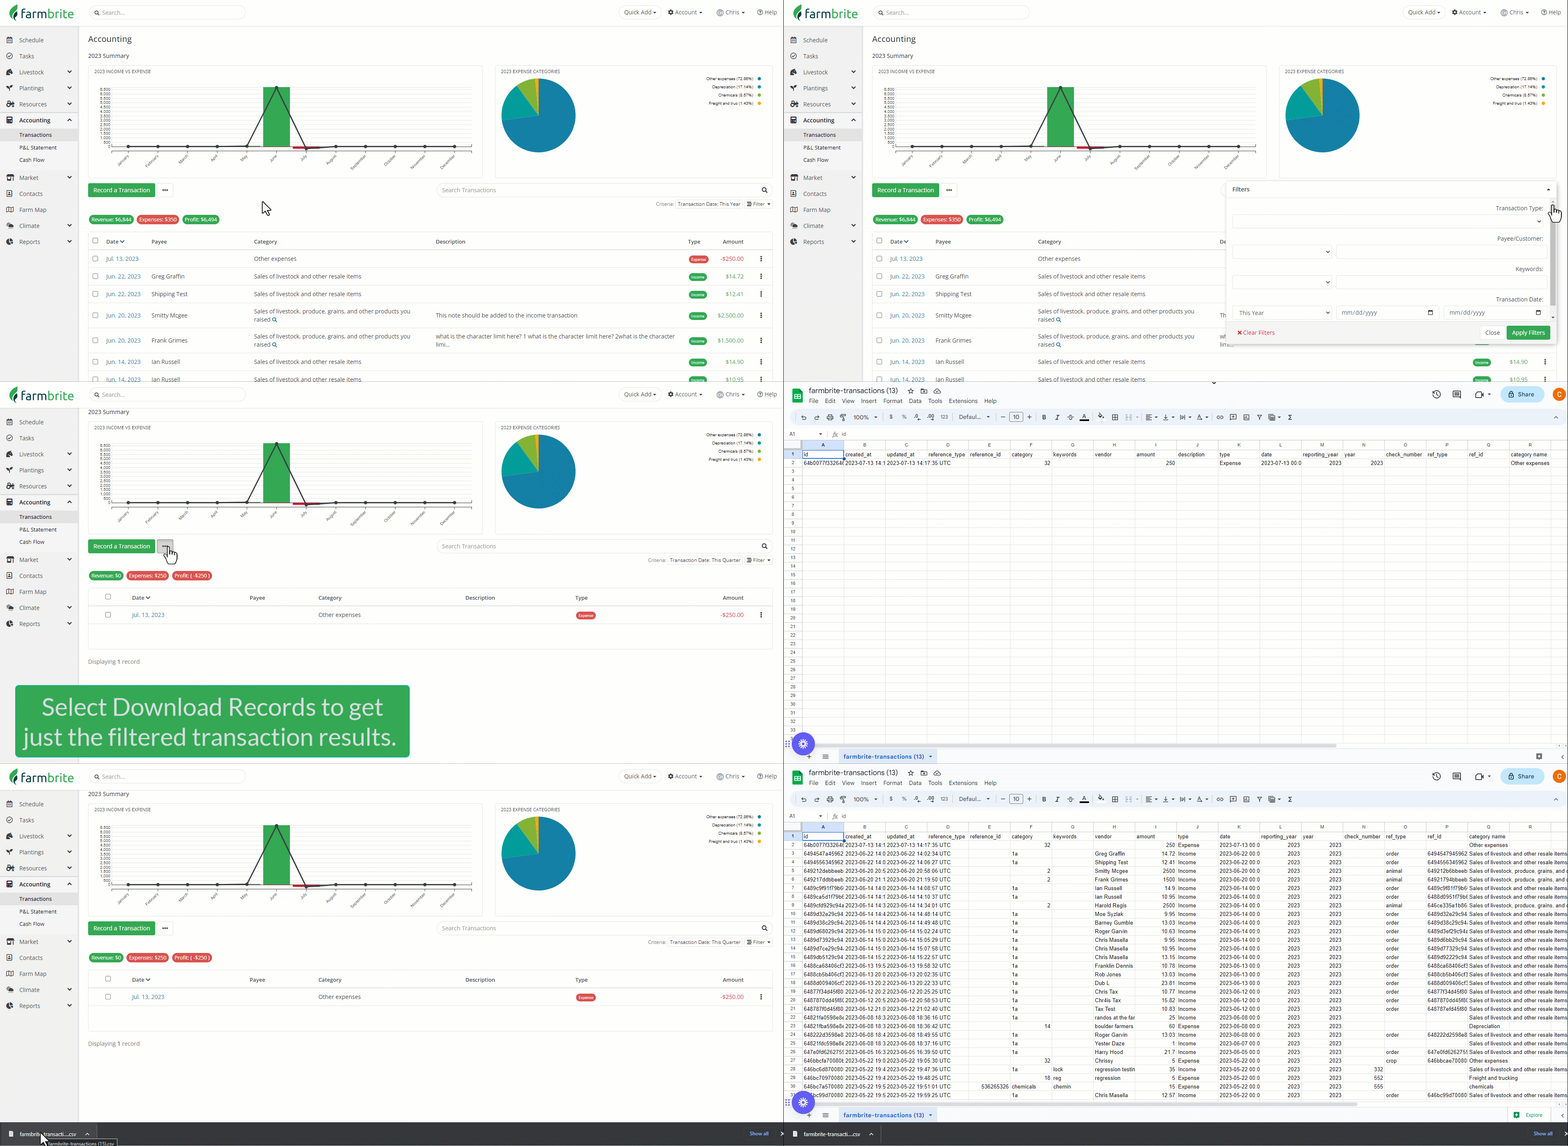
You can also download these transactions into a spreadsheet if you'd like to work with them outside of Farmbrite. Maybe you need to import them into a different system, or just want to run some formulas to find different totals. You can click the Actions Menu at the top of the dashboard (3 dots) and then choose Download Records/ Download All Records. The file will be added to your default downloads folder, and usually displays in the bottom left of your browser. Note that only the transactions displayed will be included in the spreadsheet if you choose Download Records, as the filters and search you apply will also be included when downloading the transactions. Choose Download All to get all transactions regardless of the filters you have set.
If you are looking for a way to get transactions into Quickbooks or another financial software, Check out our article about integrating with Zapier, as it may provide a simpler solution for getting you data into another system.
Still have questions about your transactions? Reach out to us!